The 14 Metabolic Health Biomarkers You Need to Test
High chance you're doctor isn't ordering these
One of the more common questions I get here:
“Phys - what panels should I order to better understand my metabolic state?”
We waste no time.
Here are the 14 biomarkers to keep your metabolic house in order.
Biomarker #1: Lean Body Mass-to-Visceral Fat Ratio
What it measures?
The ratio of metabolically active tissue (muscle) vs. the harmful fat wrapped around your organs.
Why it matters?
LBM/VF addresses the limitations of traditional metrics like BMI - especially for those of us who habitually resistance train.
Every 1% in relative muscle mass decreases the risk of metabolic disease by ~20%1. Meanwhile, visceral fat accumulation tracks directly with all-cause mortality2.
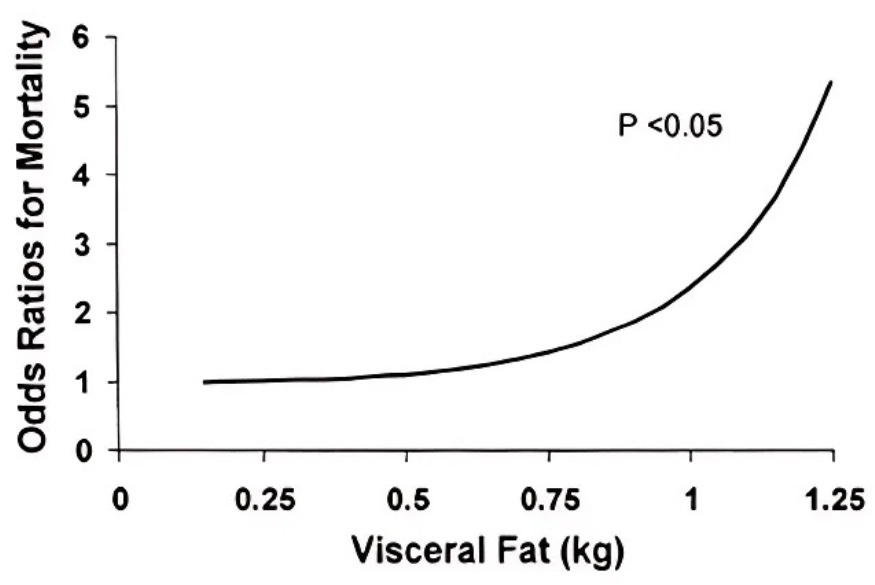
Higher LBM/VF ratios show strong inverse associations3 with dyslipidemia (A), elevated blood pressure (B), and insulin resistance (C)
This ratio becomes especially critical as you age. It captures sarcopenic obesity → the process where muscle wastes away & visceral fat accumulates simultaneously.
Optimal Ranges
**Note: All ranges are denoted in the natural logarithm format - “ln (X)” - due to the nature of the nonlinear relationship of ratio with odds ratio.
Optimal: ln(LBM/VFM) > 6.0
Good: ln(LBM/VFM) = 5.0 - 6.0
At Risk: ln(LBM/VFM) = 4.2 - 5.0
High Risk: ln(LBM/VFM) < 4.2
Biomarker #2: HbA1c
What it measures?
A 3-month average of blood glucose levels smoothing out the day-to-day variability seen with fasting glucose/postprandial glucose measurements.
Why it matters?
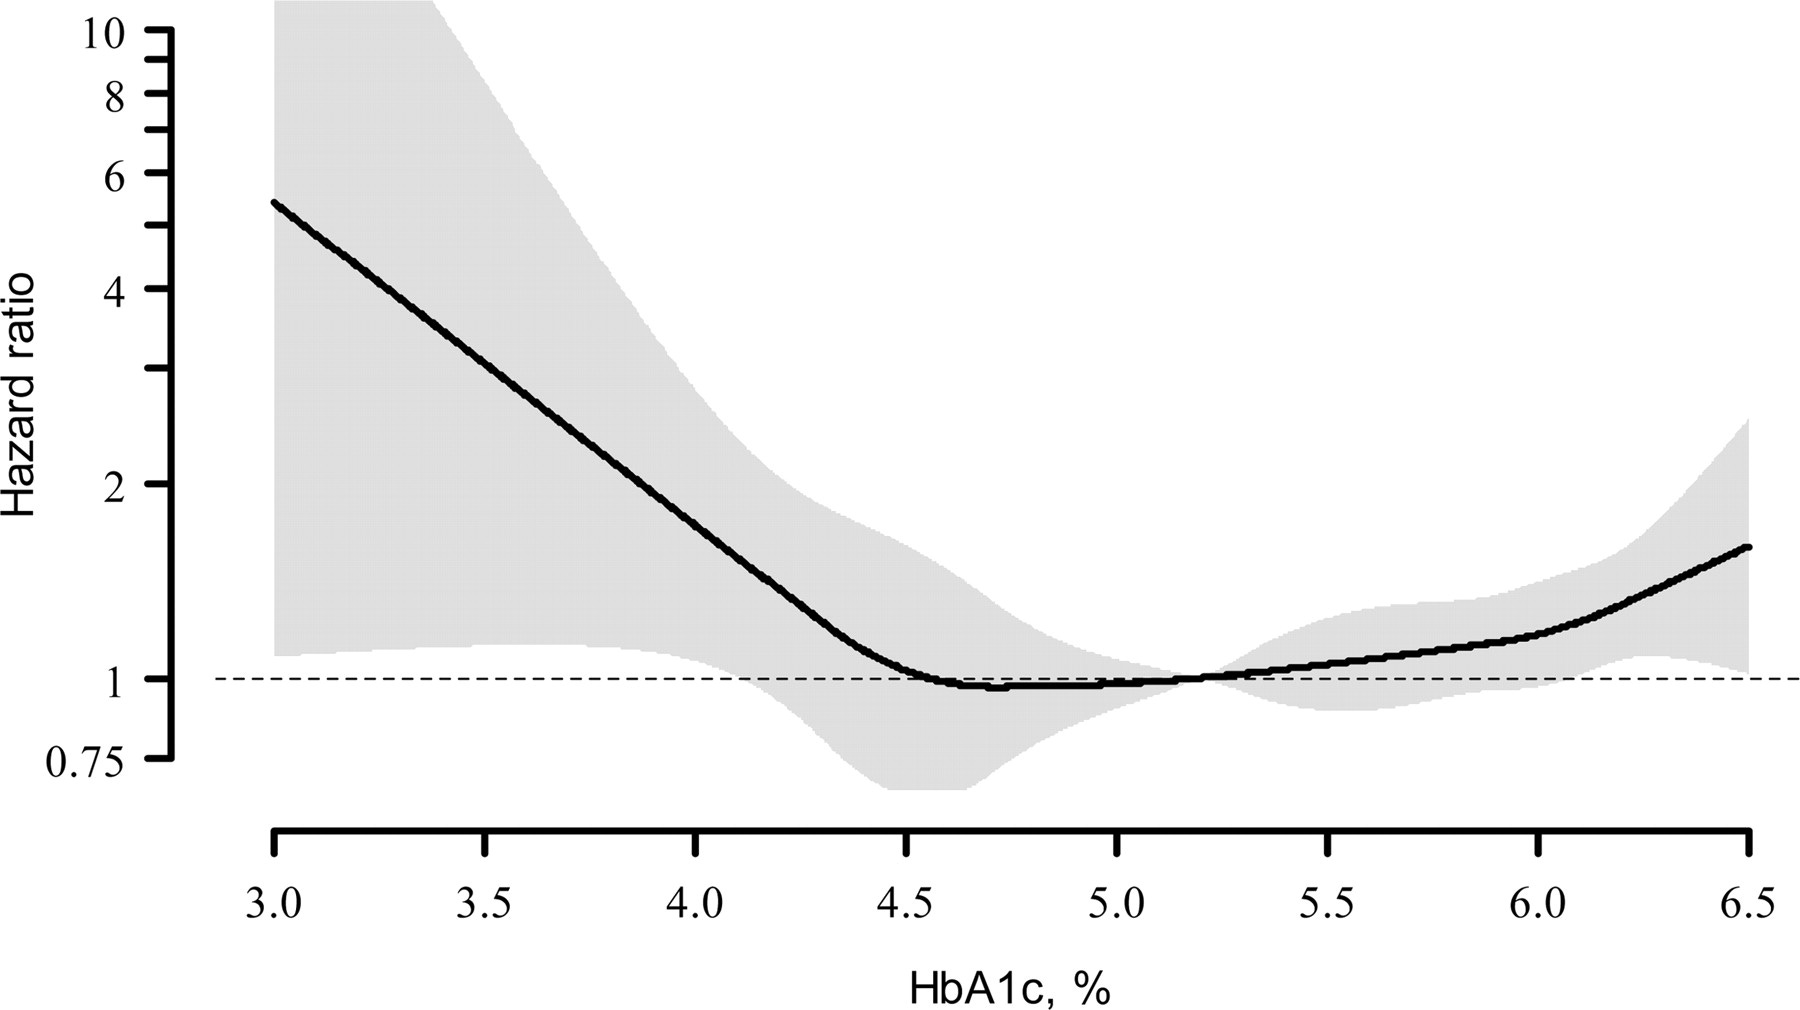
HbA1c serves as one of best biomarkers for metabolic flexibility → how efficiently you switch between burning glucose & fat for fuel. Optimal levels signal superior insulin sensitivity, robust stress responses, and enhanced ATP production. Given our metabolic health is so closely tied to cognitive health, HbA1c also represents a strong indicator of cognitive performance4 & white matter integrity in young adults.
A 2012 randomized controlled trial by Andersson et al.5 found for each 1% increase in HbA1c raised all-cause mortality risk by 12% in men and 22% in women. Similarly, a 2010 review by Carson et al.6 showed that an HbA1c of 6.0-6.4% relative to a 5.0-5.4% carried with a 28% increased mortality risk of all-cause mortality.
Optimal Ranges
Optimal: 4.6 - 5.3%
Good: 5.4 - 5.6%
Prediabetic: 5.7 - 6.4%
Diabetic: > 6.4%
Biomarker #3: Triglyceride/HDL Ratio
What it measures?
Triglycerides: The body’s densest energy storage molecule. The primary fat form in adipose tissue & the dominant lipid in VLDLs.
HDL: Compact particles (50% protein + 50% lipid) that extract excess cholesterol from tissues (especially around arterial walls) and shuttle it to the liver for elimination.
Why it matters?
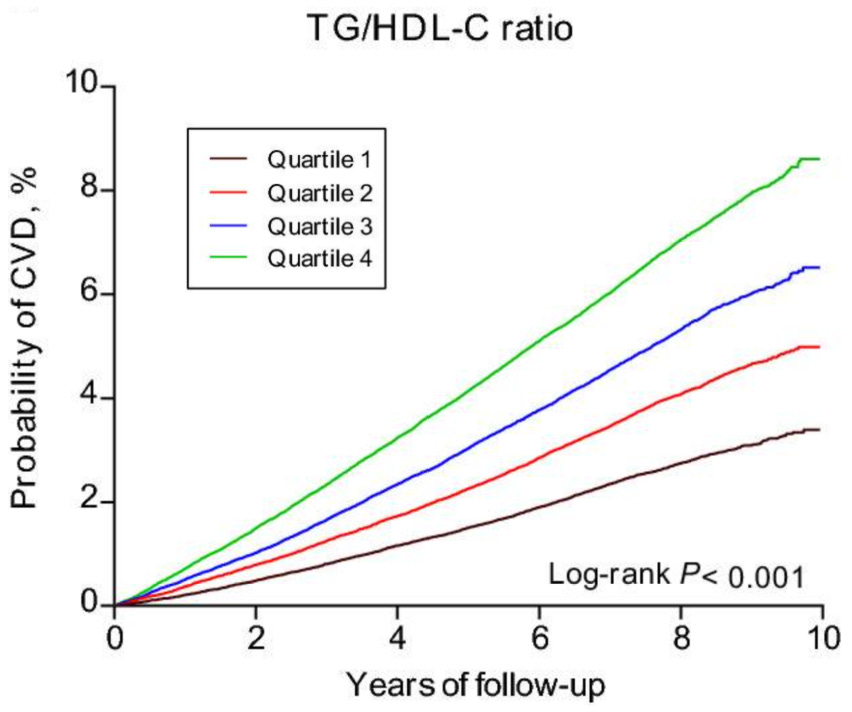
The TG/HDL ratio reveals cellular energy efficiency. An elevated ratio (high triglycerides + low HDL) signals suboptimal metabolic function: insulin resistance, chronic, low-grade inflammation, & mitochondrial dysfunction → all of which compromise the our ability to produce and utilize ATP efficiently at the cellular level.
Che et al. (2023)7 analyzed 400,000 subjects and found those in the highest TG/HDL quartile (5.5) faced 29% greater CVD risk versus the lowest quartile (1.1). This high-risk group showed higher rates of dyslipidemia (40%), hypertension (13.3%), & type 2 diabetes (11.8%).
Optimal Ranges
Optimal: < 1
Good: 1 - 2
At Risk: 2 - 3
High Risk: > 3
More on the triglyceride/HDL ratio:
Biomarker #4: ApoB/ApoA1 Ratio
What it measures?
The ApoB/ApoA1 ratio represents the balance between atherogenic & atheroprotective forces in the cardiovascular system.
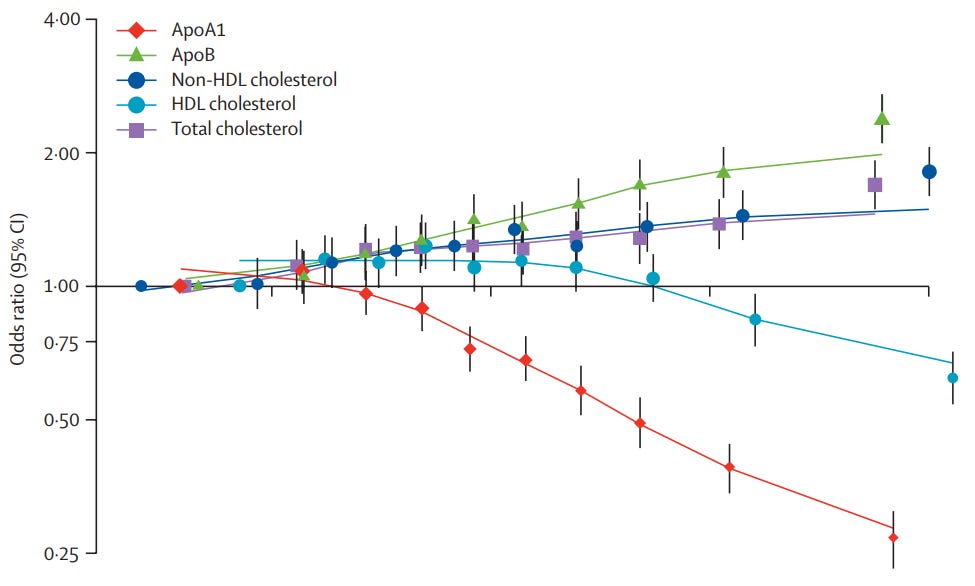
ApoB: The primary structural protein found on all atherogenic (plaque-forming) lipoproteins, including VLDL, IDL, LDL, & Lp(a). Each atherogenic particle contains exactly one ApoB molecule, making it a direct particle count of all lipoproteins capable of penetrating the arterial wall & initiating atherosclerosis.
ApoA1: The main structural & functional protein component of HDL particles → comprising ~70% of HDL protein content. Each HDL particle typically contains 2-4 ApoA1 molecules. Functions as the primary activator of lecithin-cholesterol acyltransferase (LCAT) → the enzyme responsible for cholesterol esterification and reverse cholesterol transport from peripheral tissues back to the liver.
Why it matters?
The INTERHEART study8 - a landmark case-control analysis spanning 52 countries & ~30k participants - demonstrated that the ApoB/ApoA1 ratio was the single strongest lipid predictor of myocardial infarction risk. Individuals in the highest quintile (ratio >1.0) had a 3.25-fold increased risk of acute MI compared to the lowest quintile (ratio <0.6). ApoB/ApoA1 ratio outperformed all conventional lipid markers (i.e. total cholesterol, LDL-C, HDL-C, & triglycerides) in predicting cardiovascular events.

Optimal Ranges
Optimal: < 0.6
Good: 0.6 - 0.8
At Risk: 0.8 - 1.0
High Risk: > 1.0
Most PCPs stop at the basics.
Fasting blood glucose. Complete blood count. Maybe basic lipids. That’s it.
But if you actually care about your metabolic health, you need a complete picture → fasting insulin, ApoB, CRP, sex hormones, liver enzymes, & dozens of other markers that never make it into your standard blood draw order.
That’s why I use Superpower: a biomarker testing membership that runs 100+ markers in a single annual panel, builds you a personalized plan, & connects you with concierge-level medical practitioners.
Cost? $17/month.
Locations? 3,000+ labs nationwide.
Support? Unlimited access to 24/7 Concierge.
In the age of decentralized medicine, it’s the simplest way to take full control of your health & catch issues years before your PCP would.
The Superpower team loves the Phys audience so they’re giving you 10% off (just $179/year) with this link.
Test. Don’t guess.
Biomarker #5: Lp(a)
What it measures?
A specialized LDL particle. The apo(a) component of Lp(a) is structurally similar to plasminogen → a key protein in the blood clotting cascade giving Lp(a) a dual threat: atherogenic (plaque-promoting) & prothrombotic (clot-forming) properties.
Why it matters?
Welsh et al. (2021)9 analyzed over 400,000 UK Biobank participants and found each 50 nmol/L increase in Lp(a) raised CVD risk by 11%.
Optimal Ranges
Optimal: < 30 mg/dL (< 75 nmol/L)
Good: 30 - 50 mg/dL (75 - 125 nmol/L)
At Risk: 50 - 80 mg/dL (125 - 200 nmol/L)
High Risk: > 80 mg/dL (> 200 nmol/L)
Biomarker #6: Blood Pressure
What it measures?
The force circulating blood exerts against arterial walls during cardiac contraction (systolic) and relaxation (diastolic). Elevated BP is often the first visible sign of metabolic deterioration.

Why it matters?
Our blood pressure values demonstrate integrity across four main systems:
Vascular: When vascular function deteriorates, systolic BP is first to rise disproportionately. Insulin resistance impairs nitric oxide-mediated vasodilation by downregulating endothelial nitric oxide synthase (eNOS). As a result, we get a vicious cycle10: inadequate NO → impaired vasodilation → AGE accumulation and chronic inflammation → vascular wall damage → increased systemic resistance → reduced metabolic substrate delivery → metabolic dysfunction.
Metabolic Health: Insulin resistance directly drives hypertension. In metabolically healthy individuals, insulin promotes vasodilation via the NO pathway. In insulin-resistant individuals, this mechanism fails: blood vessels constrict → sodium retention increases → vascular pressure rises.
Autonomic Nervous System: Elevated blood pressure also provides us with an indication of chronic sympathetic dominance11: elevated levels of resting heart rate, vascular tone, & glucocorticoid levels.
Kidney Function: Renal blood pressure dysregulation12 typically manifests in diastolic elevation first preceding renal damage detectable by creatinine or eGFR.
Wang et al. (2022)13 found that maintaining systolic BP between 110-130 mmHg reduced CVD risk by 19% & all-cause mortality by 11%.
Optimal Ranges (mmHg)
Optimal
Systolic: 105 - 115
Diastolic: 65 - 75
Good
Systolic: 116 - 120
Diastolic: 76 - 80
At Risk
Systolic: 121 - 129
Diastolic: 81 - 85
High Risk
Systolic: ≥ 130
Diastolic: ≥ 85
Biomarker #7: Fasting Insulin
What it measures?
Circulating insulin concentration after an 8-12 hour fast. Unlike other metabolic markers, fasting insulin captures the dynamic balance between pancreatic insulin secretion & cellular insulin clearance.
Why it matters?
Fasting insulin functions as an early-warning system for metabolic dysfunction. When cells become insulin-resistant, the pancreas compensates by flooding the bloodstream with extra insulin to maintain normal glucose levels—a state called compensatory hyperinsulinemia.
Chronically high insulin triggers a cocktail of metabolic damage:
Optimal Ranges
Optimal: 1.5-3.0 μU/mL
Good: 3.1-5.0 μU/mL
At Risk: 5.1-10.0 μU/mL
High Risk: >10.0 μU/mL
Biomarker #8: Fasting Blood Glucose
What it measures?
The steady-state plasma glucose concentration after an overnight fast reflecting the balance between hepatic glucose production & peripheral glucose utilization without any dietary input.
Why it matters?
In the metabolically elite, glucose production is suppressed by insulin concentrations coming from the pancreas, while counter-regulatory hormones like glucagon, growth hormone, & cortisol maintain glucose availability for tissues using glucose throughout our bodies. Conversely, elevated fasting glucose indicates either inadequate insulin secretion or peripheral insulin resistance18 affecting glucose uptake by skeletal muscle & adipose tissue.
A 2017 prospective cohort study by Yi et al.19 detailed the relationship between fasting blood glucose & all-cause mortality:
“In individuals with fasting glucose levels of 100–125 mg/dL, each 18 mg/dL increase in fasting glucose was associated with a 30% increase in the risk for mortality in those aged 18–34 years, a 32% increase in those aged 35–44 years, and a 10% increase in those aged 75–99 years. The fasting glucose levels associated with the lowest mortality were 80–94 mg/dL regardless of sex and age.”
Optimal Ranges
Optimal: 70-85 mg/dL (3.9-4.7 mmol/L)
Good: 86-95 mg/dL (4.8-5.3 mmol/L)
At Risk: 96-99 mg/dL (5.3-5.5 mmol/L)
High Risk: ≥100 mg/dL (≥5.6 mmol/L)
Biomarker #9: CRP
What it measures?
A hepatic inflammatory marker serving as a primary proxy for systemic inflammation & tissue damage. While commonly used to detect acute infections, CRP also reveals chronic metabolic inflammation.
Why it matters?
CRP exposes the low-grade chronic inflammation state underlying metabolic syndrome20. The JUPITER trial21 demonstrated that individuals with low LDL-C but elevated CRP still faced high CVD risk → proving inflammation drives cardiovascular disease independent of cholesterol levels.
An analysis of over 23,000 middle-aged participants from Lee et al. (2016)22 found those with CRP around 4.5 mg/L had double the all-cause mortality risk versus the lowest CRP group (0.5 mg/L).
Control of low-grade inflammation has also become increasingly associated with aging as CRP levels naturally rise with age23, but less so with those demonstrating exceptional longevity potential.
Optimal Ranges
Optimal: < 0.5 mg/L
Good: 0.5-1.0 mg/L
At Risk: 1.0-3.0 mg/L
High Risk: > 3.0 mg/L
Biomarker #10: Waist-to-Height Ratio
What it measures?
A measure of midsection adiposity → specifically visceral & subcutaneous abdominal fat distribution relative to body height.
Why it matters?
Outside of DEXA scans, WHtR provides the best proxy for visceral adipose tissue volume. Accumulated visceral fat functions as an inflammatory factory secreting molecules that disrupt insulin signaling & drive insulin resistance.
Ashwell et al. (2014)24 demonstrated WHtR predicts years of life lost better than BMI, with mortality risk spiking once WHtR exceeds 0.50. Even normal-BMI individuals with WHtR >0.50 face significantly elevated cardiovascular risk25 compared to those with normal BMI and low WHtR.
Optimal Ranges
Optimal: < 0.45
Good: 0.45 - 0.50
At Risk: 0.50 - 0.60
High Risk: ≥ 0.60
Biomarker #11: ALT/AST
What they measure?
Alanine aminotransferase (ALT) and aspartate aminotransferase (AST)—liver enzymes that reveal hepatic metabolic capacity.
ALT: Drives gluconeogenesis by converting amino acids into glucose. Elevated levels indicate hepatic strain from maintaining blood glucose during fasting or metabolic stress.
AST: Found in both hepatocytes & mitochondria, AST reflects liver function and cellular energy production capacity.
Why it matters?
Elevated ALT & AST signal a liver working extra hard to maintain metabolic homeostasis amid insulin resistance, chronic inflammation, or metabolic inflexibility. As cells become insulin-resistant, the liver compensates by ramping up glucose production & nutrient processing driving enzyme levels higher.
Kunutsor et al. (2014)26 tracked 9 million adults over two decades and found ALT levels between 10-15 U/L correlated with the lowest all-cause mortality risk.
Similarly, AST levels of 10-20 U/I were associated with the greatest reduction in overall mortality risk.
Optimal Ranges
Optimal: ALT (10-15 IU/L) & AST (10-20 IU/L)
Good: ALT (16-26 IU/L) & AST (21-30 IU/L)
At Risk: ALT (27-35 IU/L) & AST (31-40 IU/L)
High Risk: ALT (> 35 IU/L) & AST (> 40 IU/L)
Biomarker #12: Presence of Skin Tags
What it measures?
Skin tags (acrochordons) are small, soft, flesh-colored growths appearing in skin folds (i.e. neck, armpits, groin). Though benign, they signal underlying metabolic dysfunction.

Why it matters?
These represent a visible, early symptom of systemic metabolic dysfunction. Insulin resistance activates insulin-like growth factor-127 (IGF-1) receptors on fibroblasts & keratinocytes directly stimulating the formation of skin tags. Skin tags are also linked to increased levels of circulating leptin28 & pro-inflammatory cytokines contributing to the chronic, low-grade inflammation state.
*Note: Our skin health serves as a robust proxy for the state of our metabolic & gut health. Other skin-related disorders mechanistically connected & associated with metabolic syndrome: psoriasis29, acne30, baldness31, & even skin cancers32.
Optimal Ranges
Optimal: No skin tags present
Good: 1 - 2 small, isolated skin tags
At Risk: 3 - 5 skin tags or multiple lesions in skin folds
High Risk: > 5 skin tags, large or rapidly increasing in number
Biomarker #13: Cystatin C
What it measures?
Most clinicians default to creatinine for kidney function assessment, however it fluctuates with skeletal muscle mass, diet, and supplementation. Particularly problematic for many here training regularly & intensely. Cystatin C provides a more stable, accurate measure of glomerular filtration & waste clearance.
Why it matters?
Cystatin C detects early renal dysfunction while also signaling broader systemic metabolic stress.
Song et al. (2024)33 found elevated cystatin C levels correlated with 63% increased all-cause mortality risk, 53% increased CVD mortality, & 53% increased cancer mortality.
Optimal Ranges
Optimal: < 0.75 mg/L
Good: 0.76 - 0.85 mg/L
At Risk: 0.86 - 0.95 mg/L
High Risk: > 0.95 mg/L
Biomarker #14: Homocysteine
What it measures?
A sulfur-containing amino acid produced when the body metabolizes methionine from dietary protein. Normally, homocysteine is recycled via B vitamin-dependent pathways requiring B6, B9, & B12 as cofactors. When these recycling pathways fail, homocysteine accumulates.
Why it matters?
Liu et al. (2024)34 tracked 1,739 US adults with existing CVD over 10 years and found elevated homocysteine increased mortality risk—even at levels conventionally considered “normal.” Moderate levels (9.3-12.5 μmol/L) showed a 26% increased CVD death risk, while elevated levels (>12.5 μmol/L) showed a+69% CVD death risk.
Optimal Ranges
Optimal: < 7 μmol/L
Good: 7 - 10 μmol/L
At Risk: 10 - 15 μmol/L
High Risk: > 15 μmol/L
To summarize our list of 14:
Lean Body Mass-to-Visceral Fat Ratio
HbA1c
Trig/HDL Ratio
ApoB/ApoA1 Ratio
Lp(a)
Blood Pressure
Fasting Insulin
Fasting Blood Glucose
CRP
Wait-to-Height Ratio
ALT/AST
Presence of Skin Tags
Cystatin C
Homocysteine
And remember test. Don’t guess.
Your friend,
Phys
Oh YH, Choi S, Lee G, Son JS, Kim KH, Park SM. Changes in Body Composition Are Associated with Metabolic Changes and the Risk of Metabolic Syndrome. J Clin Med. 2021 Feb 13;10(4):745. doi: 10.3390/jcm10040745. PMID: 33668451; PMCID: PMC7918782.
Kuk JL, Katzmarzyk PT, Nichaman MZ, Church TS, Blair SN, Ross R. Visceral fat is an independent predictor of all-cause mortality in men. Obesity (Silver Spring). 2006 Feb;14(2):336-41. doi: 10.1038/oby.2006.43. PMID: 16571861.
Shao, Y., Wang, N., Shao, M. et al. The lean body mass to visceral fat mass ratio is negatively associated with cardiometabolic disorders: a cross-sectional study. Sci Rep 15, 3422 (2025). https://doi.org/10.1038/s41598-025-88167-1
Repple J, Karliczek G, Meinert S, Förster K, Grotegerd D, Goltermann J, Redlich R, Arolt V, Baune BT, Dannlowski U, Opel N. Variation of HbA1c affects cognition and white matter microstructure in healthy, young adults. Mol Psychiatry. 2021 Apr;26(4):1399-1408. doi: 10.1038/s41380-019-0504-3. Epub 2019 Aug 29. Erratum in: Mol Psychiatry. 2021 Apr;26(4):1409. doi: 10.1038/s41380-020-0710-z. PMID: 31467393.
Andersson C, van Gaal L, Caterson ID, Weeke P, James WP, Coutinho W, Finer N, Sharma AM, Maggioni AP, Torp-Pedersen C. Relationship between HbA1c levels and risk of cardiovascular adverse outcomes and all-cause mortality in overweight and obese cardiovascular high-risk women and men with type 2 diabetes. Diabetologia. 2012 Sep;55(9):2348-55. doi: 10.1007/s00125-012-2584-3. Epub 2012 May 26. Erratum in: Diabetologia. 2012 Oct;55(10):2860. Couthino, W [corrected to Coutinho, W]. PMID: 22638548.
Carson AP, Fox CS, McGuire DK, Levitan EB, Laclaustra M, Mann DM, Muntner P. Low hemoglobin A1c and risk of all-cause mortality among US adults without diabetes. Circ Cardiovasc Qual Outcomes. 2010 Nov;3(6):661-7. doi: 10.1161/CIRCOUTCOMES.110.957936. Epub 2010 Oct 5. PMID: 20923991; PMCID: PMC4734630.
Che B, Zhong C, Zhang R, Pu L, Zhao T, Zhang Y, Han L. Triglyceride-glucose index and triglyceride to high-density lipoprotein cholesterol ratio as potential cardiovascular disease risk factors: an analysis of UK biobank data. Cardiovasc Diabetol. 2023 Feb 16;22(1):34. doi: 10.1186/s12933-023-01762-2. PMID: 36797706; PMCID: PMC9936712.
McQueen MJ, Hawken S, Wang X, Ounpuu S, Sniderman A, Probstfield J, Steyn K, Sanderson JE, Hasani M, Volkova E, Kazmi K, Yusuf S; INTERHEART study investigators. Lipids, lipoproteins, and apolipoproteins as risk markers of myocardial infarction in 52 countries (the INTERHEART study): a case-control study. Lancet. 2008 Jul 19;372(9634):224-33. doi: 10.1016/S0140-6736(08)61076-4. PMID: 18640459.
Welsh P, Welsh C, Celis-Morales CA, Brown R, Ho FK, Ferguson LD, Mark PB, Lewsey J, Gray SR, Lyall DM, Gill JMR, Pell JP, de Lemos JA, Willeit P, Sattar N. Lipoprotein(a) and cardiovascular disease: prediction, attributable risk fraction, and estimating benefits from novel interventions. Eur J Prev Cardiol. 2022 Feb 9;28(18):1991-2000. doi: 10.1093/eurjpc/zwaa063. PMID: 33624048.
Tomiyama H. Vascular function: a key player in hypertension. Hypertens Res. 2023 Sep;46(9):2145-2158. doi: 10.1038/s41440-023-01354-3. Epub 2023 Jun 27. PMID: 37369849.
Esler M, Straznicky N, Eikelis N, Masuo K, Lambert G, Lambert E. Mechanisms of sympathetic activation in obesity-related hypertension. Hypertension. 2006 Nov;48(5):787-96. doi: 10.1161/01.HYP.0000242642.42177.49. Epub 2006 Sep 25. PMID: 17000932.
Hall JE. The kidney, hypertension, and obesity. Hypertension. 2003 Mar;41(3 Pt 2):625-33. doi: 10.1161/01.HYP.0000052314.95497.78. Epub 2003 Jan 20. PMID: 12623970.
Wang A, Tian X, Zuo Y, Chen S, Zhang Y, Zhang X, Deng X, Xu Q, Wang P, Wu S, Zhou Y. Control of Blood Pressure and Risk of Cardiovascular Disease and Mortality in Elderly Chinese: A Real-World Prospective Cohort Study. Hypertension. 2022 Aug;79(8):1866-1875. doi: 10.1161/HYPERTENSIONAHA.122.19587. Epub 2022 Jun 15. PMID: 35706092.
Bungau S, Behl T, Tit DM, Banica F, Bratu OG, Diaconu CC, Nistor-Cseppento CD, Bustea C, Aron RAC, Vesa CM. Interactions between leptin and insulin resistance in patients with prediabetes, with and without NAFLD. Exp Ther Med. 2020 Dec;20(6):197. doi: 10.3892/etm.2020.9327. Epub 2020 Oct 14. PMID: 33123227; PMCID: PMC7588790.
de Rooij SR, Nijpels G, Nilsson PM, Nolan JJ, Gabriel R, Bobbioni-Harsch E, Mingrone G, Dekker JM; Relationship Between Insulin Sensitivity and Cardiovascular Disease (RISC) Investigators. Low-grade chronic inflammation in the relationship between insulin sensitivity and cardiovascular disease (RISC) population: associations with insulin resistance and cardiometabolic risk profile. Diabetes Care. 2009 Jul;32(7):1295-301. doi: 10.2337/dc08-1795. Epub 2009 Apr 14. PMID: 19366964; PMCID: PMC2699728.
Huang H, Zheng X, Wen X, Zhong J, Zhou Y, Xu L. Visceral fat correlates with insulin secretion and sensitivity independent of BMI and subcutaneous fat in Chinese with type 2 diabetes. Front Endocrinol (Lausanne). 2023 Feb 27;14:1144834. doi: 10.3389/fendo.2023.1144834. PMID: 36909323; PMCID: PMC9999013.
Ottarsdottir K, Nilsson AG, Hellgren M, Lindblad U, Daka B. The association between serum testosterone and insulin resistance: a longitudinal study. Endocr Connect. 2018 Dec 1;7(12):1491-1500. doi: 10.1530/EC-18-0480. PMID: 30592706; PMCID: PMC6311464.
Lewis ST, Greenway F, Tucker TR, Alexander M, Jackson LK, Hepford SA, Loveridge B, Lakey JRT. A Receptor Story: Insulin Resistance Pathophysiology and Physiologic Insulin Resensitization’s Role as a Treatment Modality. Int J Mol Sci. 2023 Jun 30;24(13):10927. doi: 10.3390/ijms241310927. PMID: 37446104; PMCID: PMC10341609.
Yi SW, Park S, Lee YH, Park HJ, Balkau B, Yi JJ. Association between fasting glucose and all-cause mortality according to sex and age: a prospective cohort study. Sci Rep. 2017 Aug 15;7(1):8194. doi: 10.1038/s41598-017-08498-6. PMID: 28811570; PMCID: PMC5557842.
Devaraj S, Singh U, Jialal I. Human C-reactive protein and the metabolic syndrome. Curr Opin Lipidol. 2009 Jun;20(3):182-9. doi: 10.1097/MOL.0b013e32832ac03e. PMID: 19369869; PMCID: PMC2921825.
Ridker PM. Moving beyond JUPITER: will inhibiting inflammation reduce vascular event rates? Curr Atheroscler Rep. 2013 Jan;15(1):295. doi: 10.1007/s11883-012-0295-3. PMID: 23225175; PMCID: PMC3817490.
Lee JH, Yeom H, Kim HC, Suh I, Kim MK, Shin MH, Shin DH, Koh SB, Ahn SV, Lee TY, Ryu SY, Song JS, Choe HS, Lee YH, Choi BY. C-reactive Protein Concentration Is Associated With a Higher Risk of Mortality in a Rural Korean Population. J Prev Med Public Health. 2016 Sep;49(5):275-287. doi: 10.3961/jpmph.16.025. Epub 2016 Aug 23. PMID: 27744669; PMCID: PMC5066418.
Wassel CL, Barrett-Connor E, Laughlin GA. Association of circulating C-reactive protein and interleukin-6 with longevity into the 80s and 90s: The Rancho Bernardo Study. J Clin Endocrinol Metab. 2010 Oct;95(10):4748-55. doi: 10.1210/jc.2010-0473. Epub 2010 Jul 21. PMID: 20660034; PMCID: PMC3050106.
Ashwell M, Mayhew L, Richardson J, Rickayzen B. Waist-to-height ratio is more predictive of years of life lost than body mass index. PLoS One. 2014 Sep 8;9(9):e103483. doi: 10.1371/journal.pone.0103483. PMID: 25198730; PMCID: PMC4157748.
Ashwell M, Gibson S. Waist-to-height ratio as an indicator of ‘early health risk’: simpler and more predictive than using a ‘matrix’ based on BMI and waist circumference. BMJ Open. 2016 Mar 14;6(3):e010159. doi: 10.1136/bmjopen-2015-010159. PMID: 26975935; PMCID: PMC4800150.
Kunutsor SK, Apekey TA, Seddoh D, Walley J. Liver enzymes and risk of all-cause mortality in general populations: a systematic review and meta-analysis. Int J Epidemiol. 2014 Feb;43(1):187-201. doi: 10.1093/ije/dyt192. PMID: 24585856.
González-Saldivar G, Rodríguez-Gutiérrez R, Ocampo-Candiani J, González-González JG, Gómez-Flores M. Skin Manifestations of Insulin Resistance: From a Biochemical Stance to a Clinical Diagnosis and Management. Dermatol Ther (Heidelb). 2017 Mar;7(1):37-51. doi: 10.1007/s13555-016-0160-3. Epub 2016 Dec 5. PMID: 27921251; PMCID: PMC5336429.
El Safoury O, Fawzi M, Abdel Hay RM, Hassan AS, El Maadawi Z, Rashed L. Increased tissue leptin hormone level and mast cell count in skin tags: a possible role of adipoimmune in the growth of benign skin growths. Indian J Dermatol Venereol Leprol. 2010 Sep-Oct;76(5):538-42. doi: 10.4103/0378-6323.69083. PMID: 20826994.
Gyldenløve M, Storgaard H, Holst JJ, Vilsbøll T, Knop FK, Skov L. Patients with psoriasis are insulin resistant. J Am Acad Dermatol. 2015 Apr;72(4):599-605. doi: 10.1016/j.jaad.2015.01.004. Epub 2015 Feb 1. PMID: 25653028.
Hasrat NH, Al-Yassen AQ. The Relationship Between Acne Vulgaris and Insulin Resistance. Cureus. 2023 Jan 26;15(1):e34241. doi: 10.7759/cureus.34241. PMID: 36852374; PMCID: PMC9964714.
González-González JG, Mancillas-Adame LG, Fernández-Reyes M, Gómez-Flores M, Lavalle-González FJ, Ocampo-Candiani J, Villarreal-Pérez JZ. Androgenetic alopecia and insulin resistance in young men. Clin Endocrinol (Oxf). 2009 Oct;71(4):494-9. doi: 10.1111/j.1365-2265.2008.03508.x. PMID: 19094069.
Hosseini M, Kasraian Z, Rezvani HR. Energy metabolism in skin cancers: A therapeutic perspective. Biochim Biophys Acta Bioenerg. 2017 Aug;1858(8):712-722. doi: 10.1016/j.bbabio.2017.01.013. Epub 2017 Feb 1. PMID: 28161328.
Song X, Xiong L, Guo T, Chen X, Zhang P, Zhang X, Liang Z. Cystatin C Is a Predictor for Long-Term, All-Cause, and Cardiovascular Mortality in US Adults With Metabolic Syndrome. J Clin Endocrinol Metab. 2024 Oct 15;109(11):2905-2919. doi: 10.1210/clinem/dgae225. PMID: 38597157; PMCID: PMC11479697.
Liu, D., Fang, C., Wang, J. et al. Association between homocysteine levels and mortality in CVD: a cohort study based on NHANES database. BMC Cardiovasc Disord 24, 652 (2024). https://doi.org/10.1186/s12872-024-04317-9