


My next door neighbor is a 47 year old woman. Fit hiker. Salt of the earth spirit. Three boys in high school.
Look at Melissa and you’d think her to be the last person you’d ever expect to have a massive heart attack.
But last week, a gradual buildup of atherosclerotic plaque finally caught up to her over decades.
These stories have become far too common.
Among people who die suddenly of heart disease, 64% of women & 50% of men had ZERO previous symptoms.
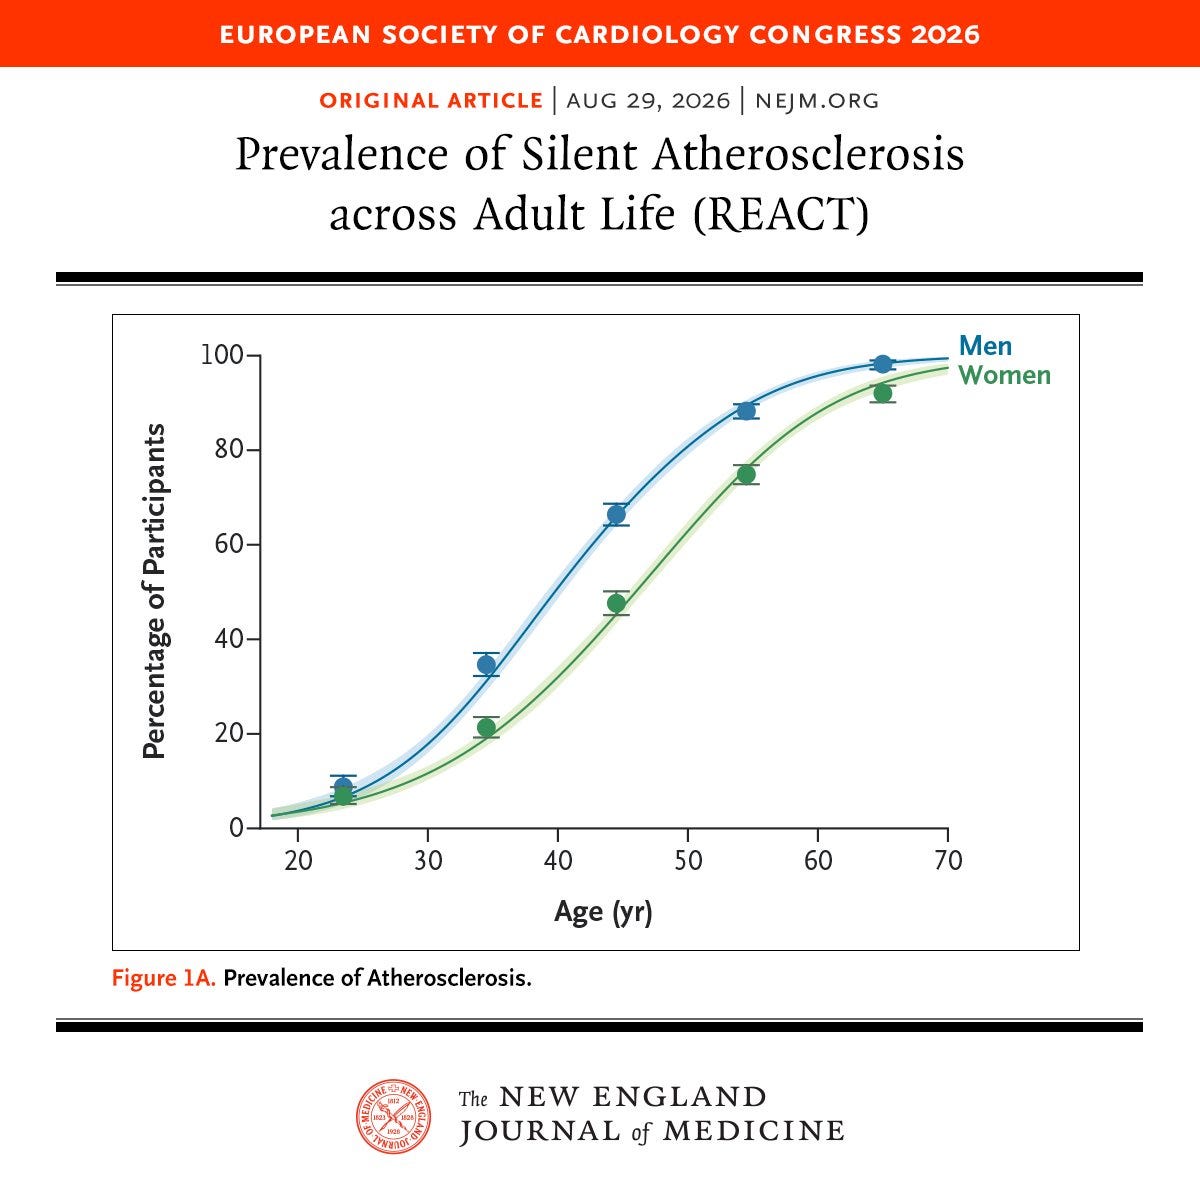
In the 2026 REACT study of almost 17k symptom-FREE adults aged 18–70, 57% had silent atherosclerosis.
1 in 13 adults in their 20s.
50% of men by 40.
90% by their 60s.
To make matters worse, the risk evaluation system we have…sucks. Especially if you’re younger.
For anyone under 50 who had a heart attack, only 49% would have qualified for preventive treatment beforehand under major US guidelines. Newer guidelines did even worse flagging only 46% of heart attack cases under 55, down from 57%.
Melissa’s story is entirely avoidable, but only if you take the right steps today. Here’s what I’d do if I were her ten years earlier.
Testing — Imaging (Part 1)
When it comes to actual diagnostic tools, there are two categories: bloodwork & imaging.
Why Actually Seeing Plaque Induces Action
In the VIPVIZA trial, ~3,500 healthy Swedes aged 40–60 got a carotid ultrasound. Half received a color picture of their own plaque. That group ended up with LOWER cardiovascular risk after 1 yr & 3 yrs.
Calcium scans prove similarly. People who saw their scans improved blood pressure, LDL, & waist size more than those without a scan in the EISNER trial. And a non-zero score also tripled the odds of starting a lipid-lowering protocol.
Onto what imaging options is top value for your bioindividualized case.
#1: Coronary CT Angiography (CCTA)
What it sees: Everything. With contrast dye, CCTA shows both calcified & soft (non-calcified) plaque and how much each artery is narrowed.
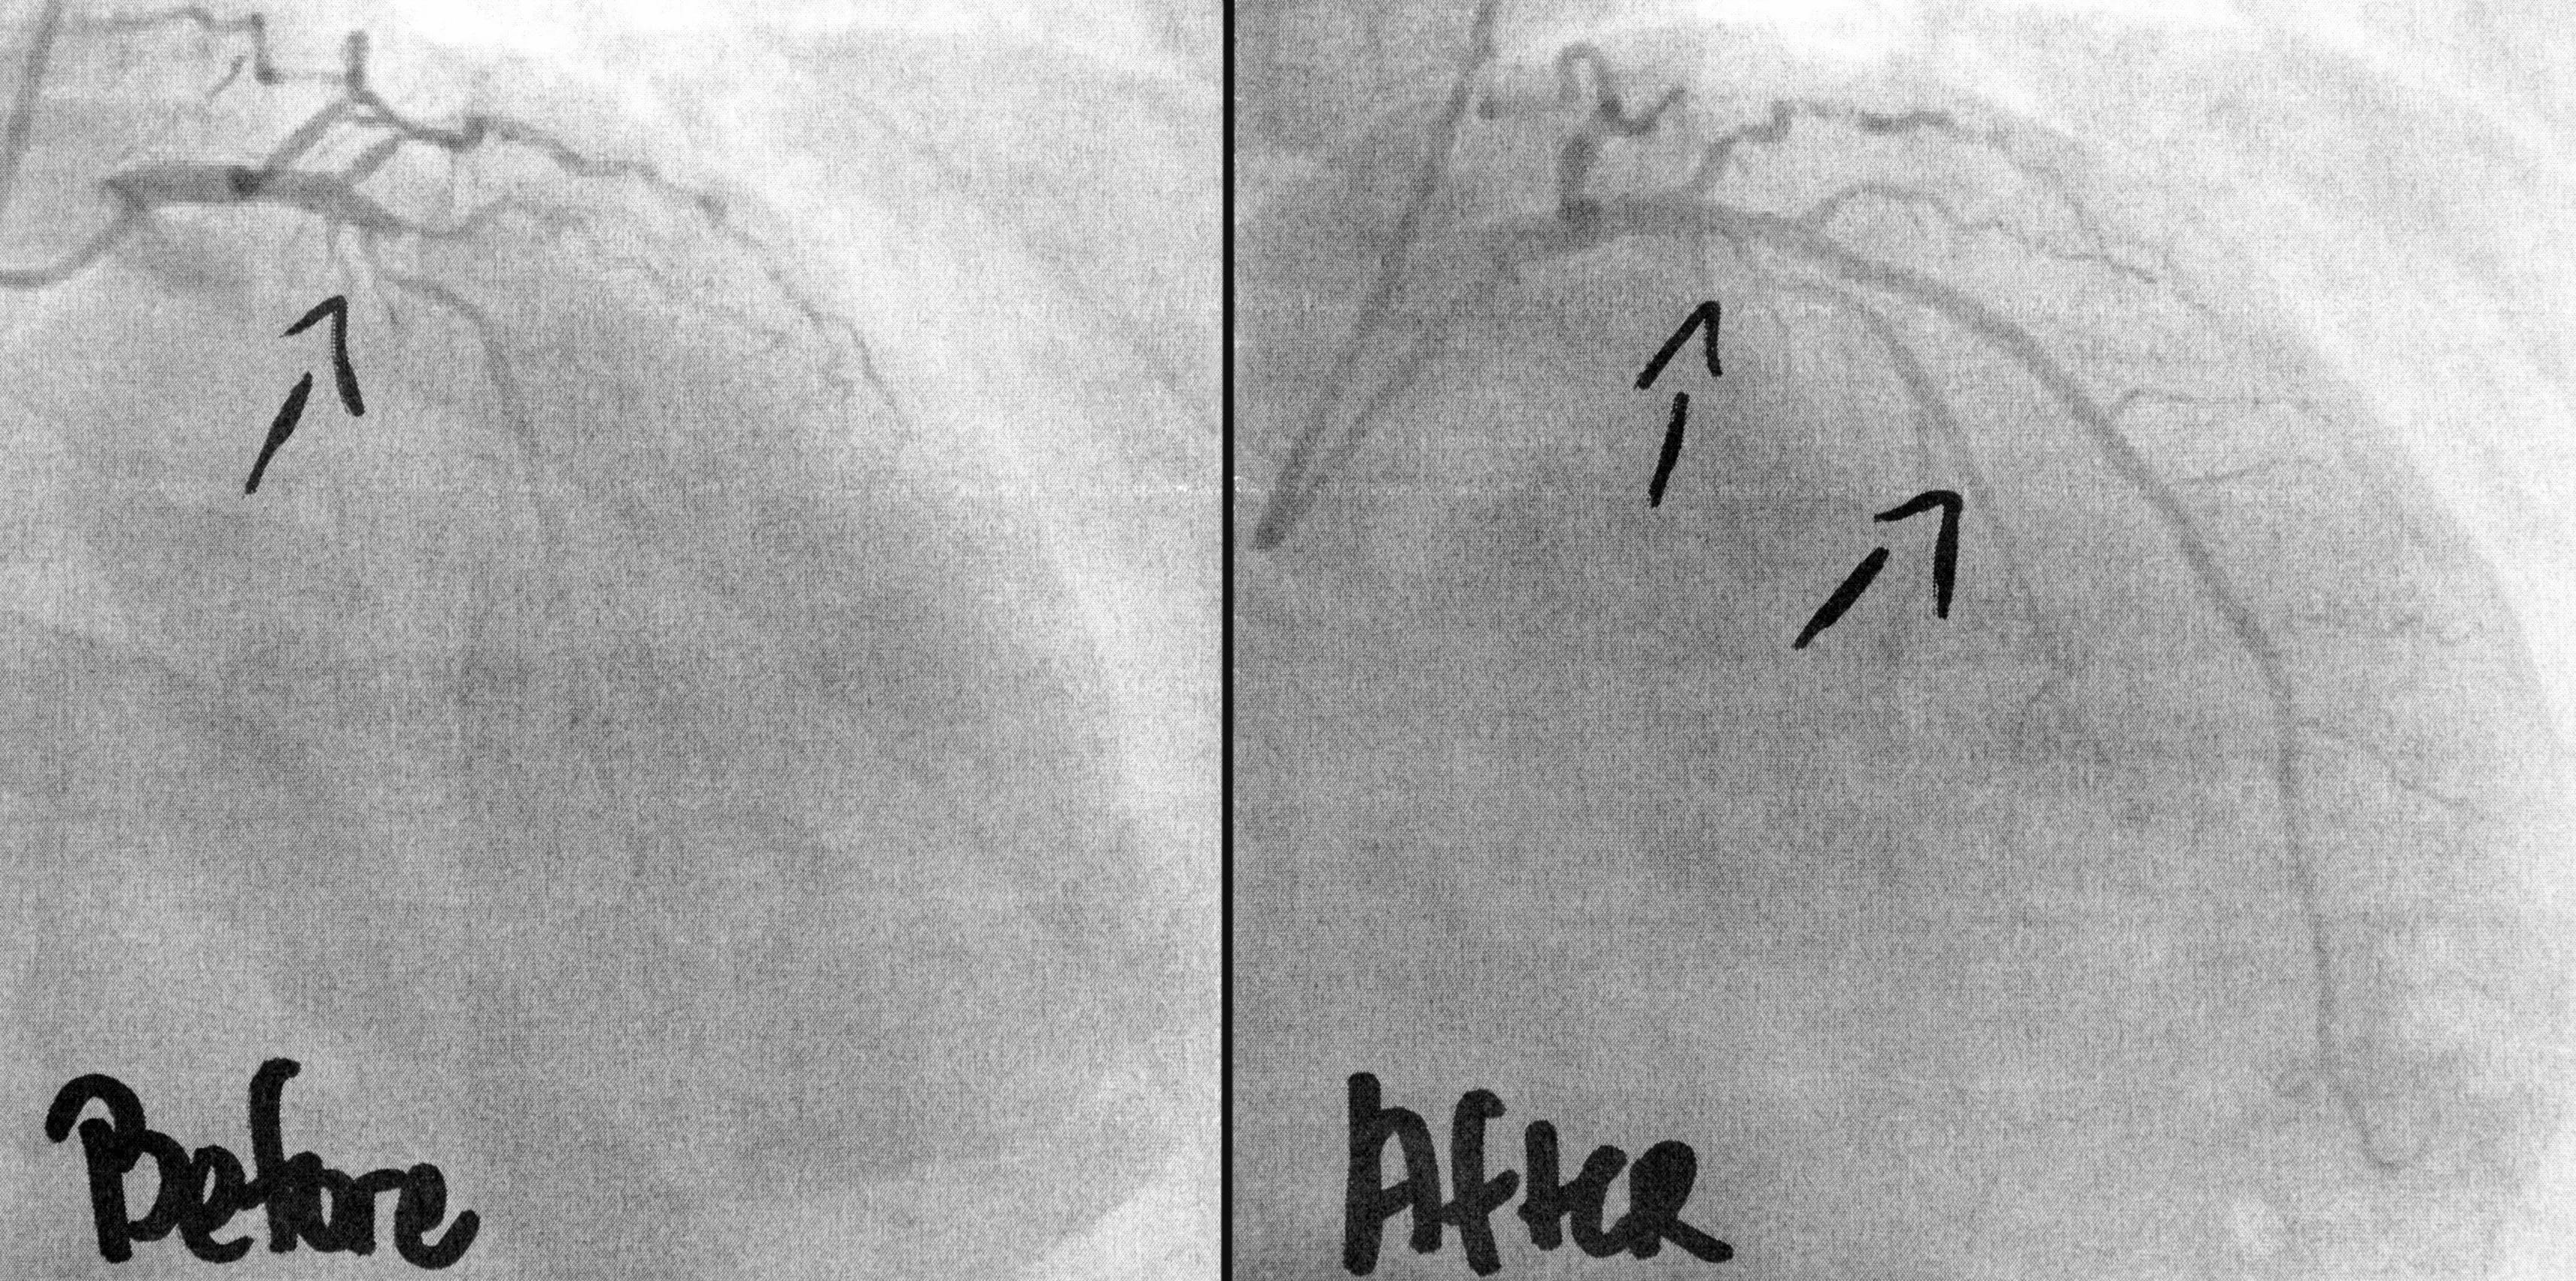
Who it’s best for: Anyone <45 with risk factor present: high ApoB, high Lp(a), family history heart disease, or metabolic disease. Also anyone with a calcium score of 0 with some risk.
Evidence: Monitoring with CCTA was linked to fewer heart attacks over 10 years (6.6% vs 8.2%). In symptom-free adults, CCTA found plaque in 16% of people whose calcium score was zero.
Cost / radiation: $400–1,500. Mean dose ~1.9 mSv on modern scanners (less than a year of natural background radiation).
#2: Coronary Artery Calcium (CAC) Score
What it sees: Calcified plaque only. Fast CT with no dye that scores the hardened plaque in coronary arteries.
Who it’s best for: Anyone 45+ deciding how aggressively to treat their risk. Also older adults who want a cost-efficient baseline.
Evidence: The “warranty period” of a 0 score is ~5 years on average with metabolic dysfunction shortening it significantly.
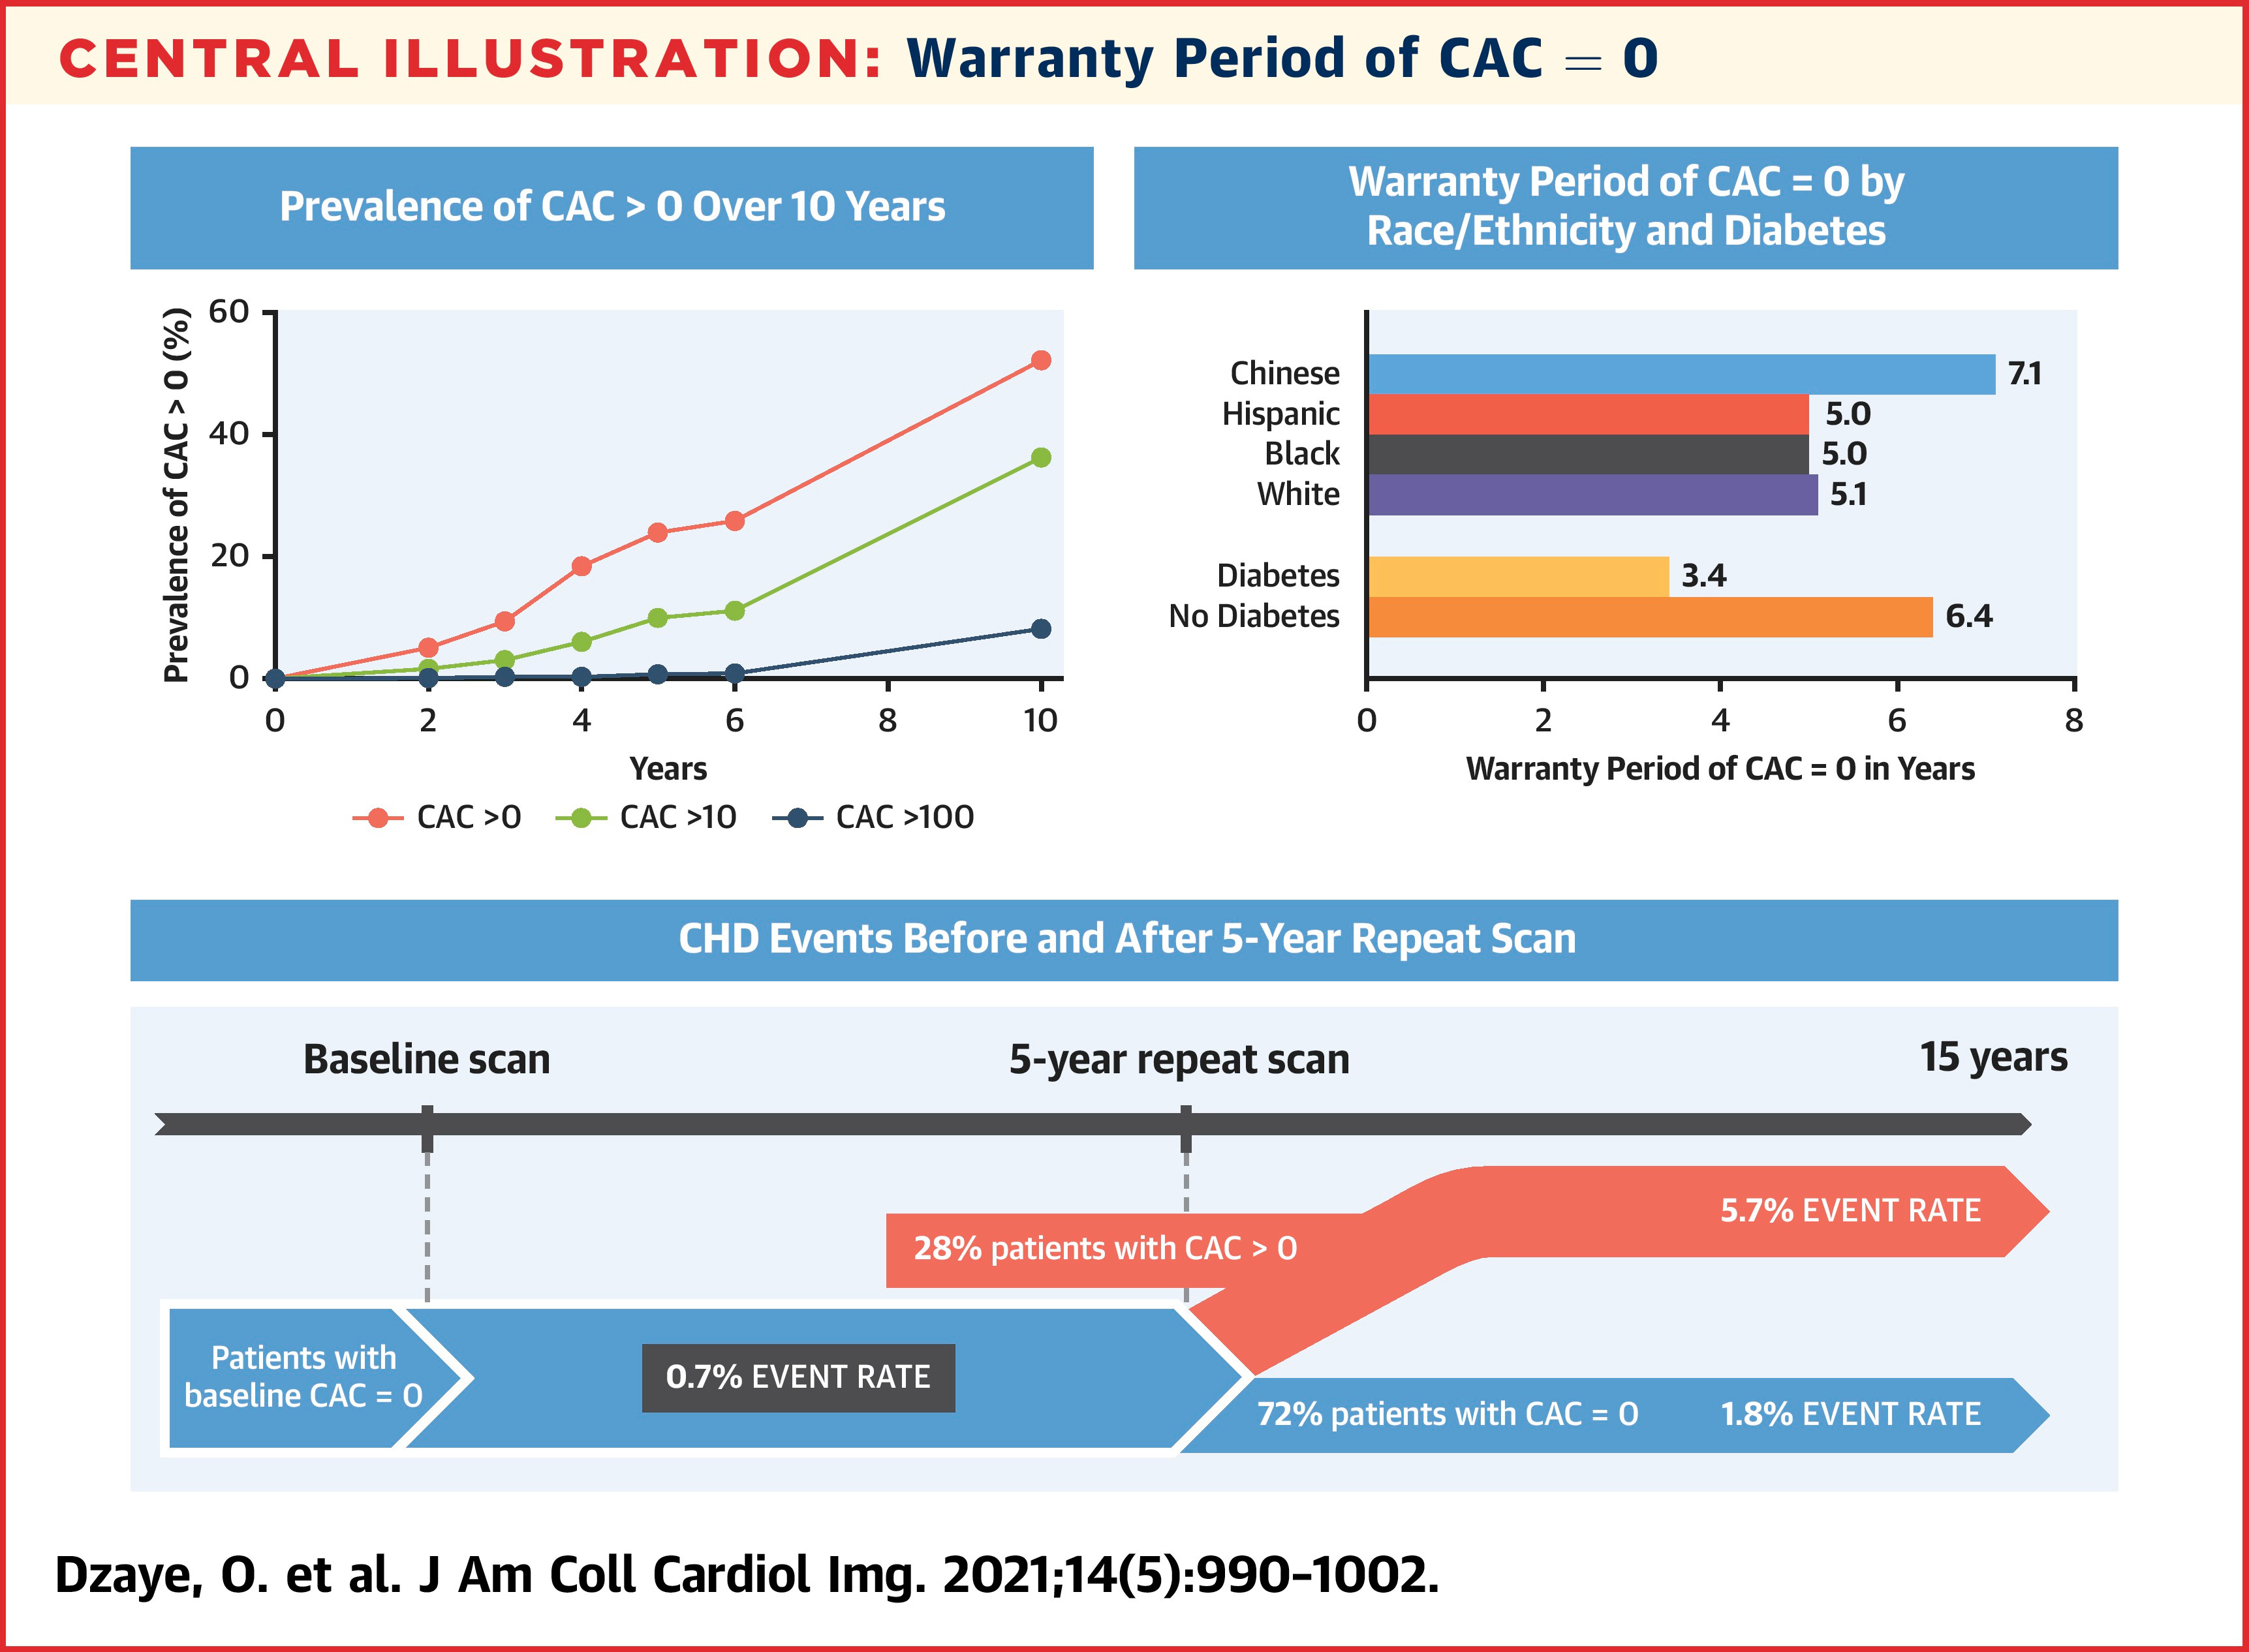
Any score above zero confirms plaque exists and a protocol should start.
Shortfalls:
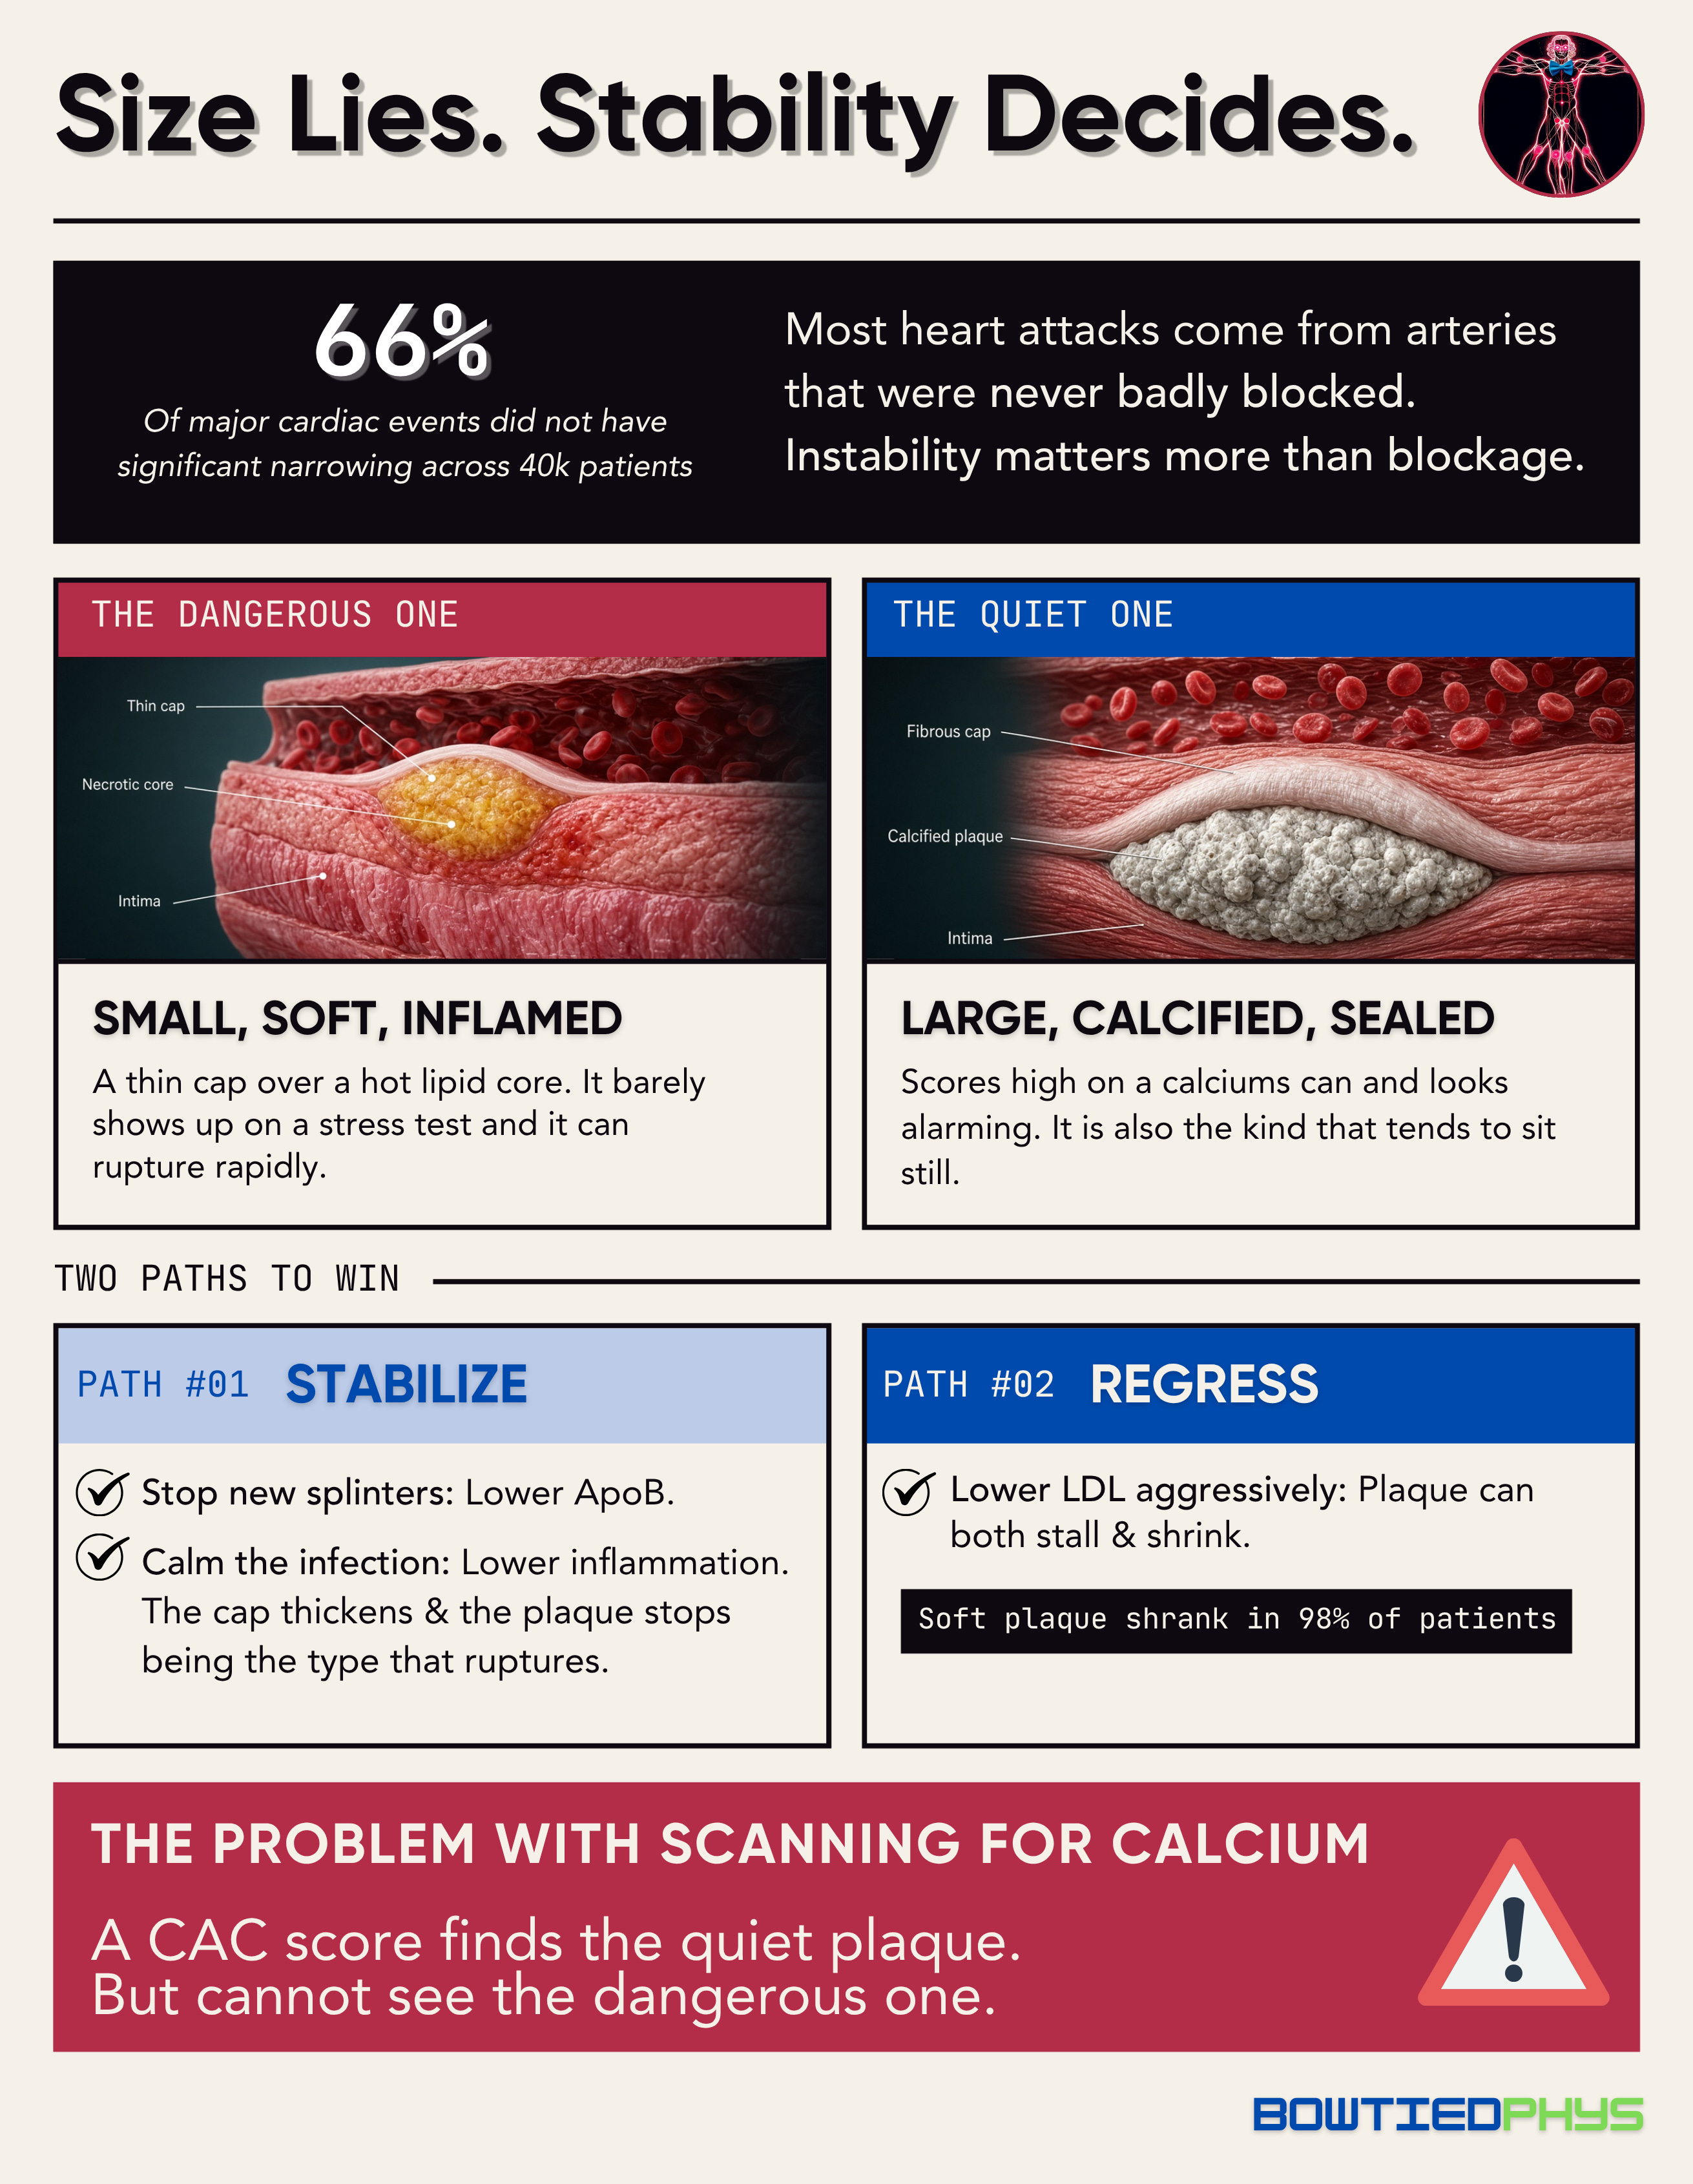
Blind to soft plaque, and young plaque is mostly soft → Across 23.8k symptomatic patients, 58% <40 with significant blockages had a calcium score of zero. Applied to 34% aged 40–49.
0 doesn’t mean clear → 16% of symptom-free adults with a 0 score still had plaque on CCTA. That share rose from 13% when LDL was under 70 mg/dL to 28% when LDL was 190+.
Poor for tracking progress → CAC scores can rise if soft plaque hardens and stabilizes, which is what you want to lower risk. In FLOWPROMOTE, calcified plaque rose while total plaque shrank. Track progress with AI-QCT plaque volume.
Cost / radiation: $75–200. ~1 mSv (~four months of natural background radiation).
#3: AI-Quantified CCTA (AI-QCT)
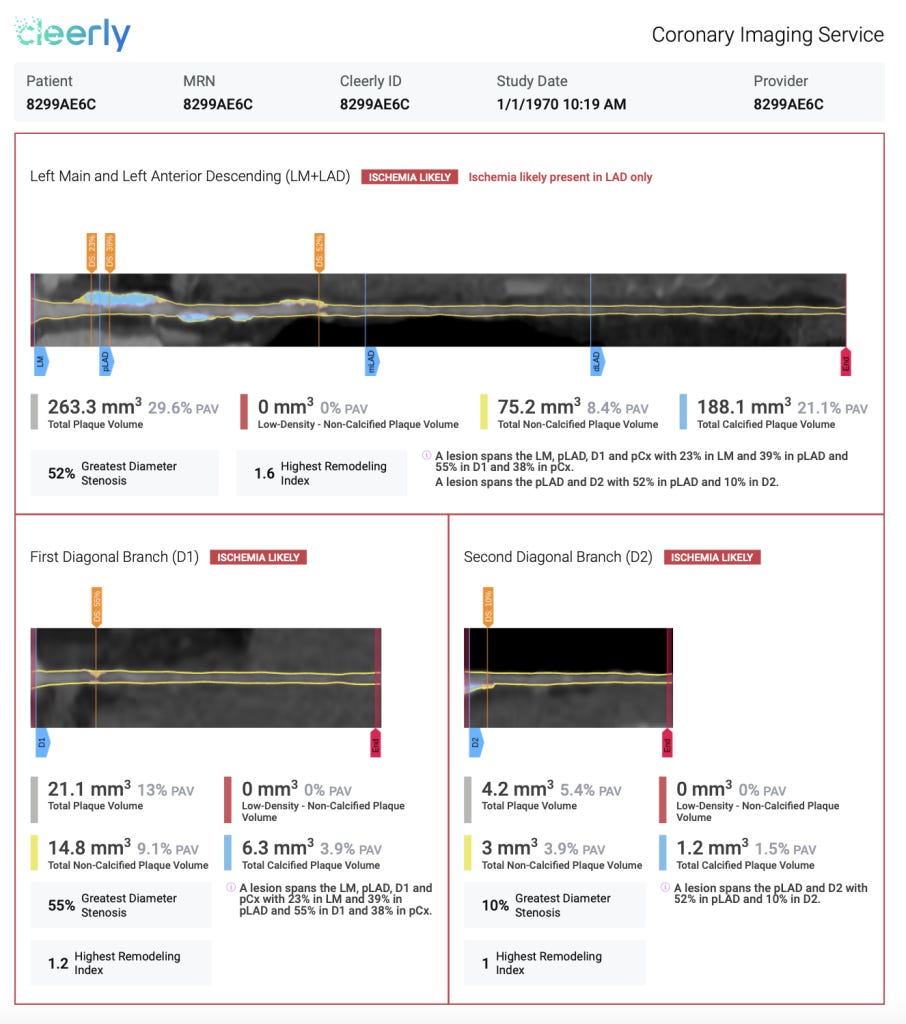
What it sees: Same CCTA images from #1. Results are ran through an app that measures plaque volume, categorizes by type (calcified, non-calcified, low-density fatty), & calculates the % of artery wall it occupies.
Platforms to pick from:
Cleerly: plaque volume and type, narrowing, and a lesion-level ischemia estimate.
HeartFlow Plaque Analysis: paired with HeartFlow’s FFRct blood-flow model (#7).
Elucid PlaqueIQ: plaque morphology with a focus on tissue composition.
Caristo CaRi-Plaque: pairs with CaRi-Heart inflammation scoring (#5).
Artrya Salix and Circle CVI42: FDA-cleared, with less US consumer reach.
Who it’s best for: Anyone getting a CCTA who wants a precise baseline. Also anyone planning to re-scan to see whether their plan is working.
Evidence: HeartFlow’s analysis agreed with intravascular ultrasound 95% of the time on total plaque volume. Cleerly’s INVICTUS registry showed similar agreement.
Cost / radiation: $500–1,500 on top of the CCTA. Same radiation as CCTA. New Category I billing code took effect January 2026 making it routine care.
#4: Carotid + Femoral Plaque Ultrasound
What it sees: Plaque in the neck (carotid) & groin (femoral) arteries.
Who it’s best for: <40 yrs of age who want a baseline look without radiation. Anyone wanting to add a second arterial territory to their coronary imaging.
Evidence: Method behind REACT (mentioned in intro), which used 3D carotid & femoral ultrasound alongside CCTA. Just knowing whether plaque is present added predictive value at every level of wall thickness in ARIC.
Shortfalls:
Indirect measure → Infers coronary disease rather than seeing it like CCTA.
Operator dependent → Ask for a plaque assessment specifically, not just a “carotid screen.” Outcome quality hinges on the technician doing it.
Tough to find → 3D plaque volume ultrasound mostly at research stage in US right now.
Cost / radiation: $100–400. No radiation.
#5: CaRi-Heart (Coronary Inflammation Scoring)
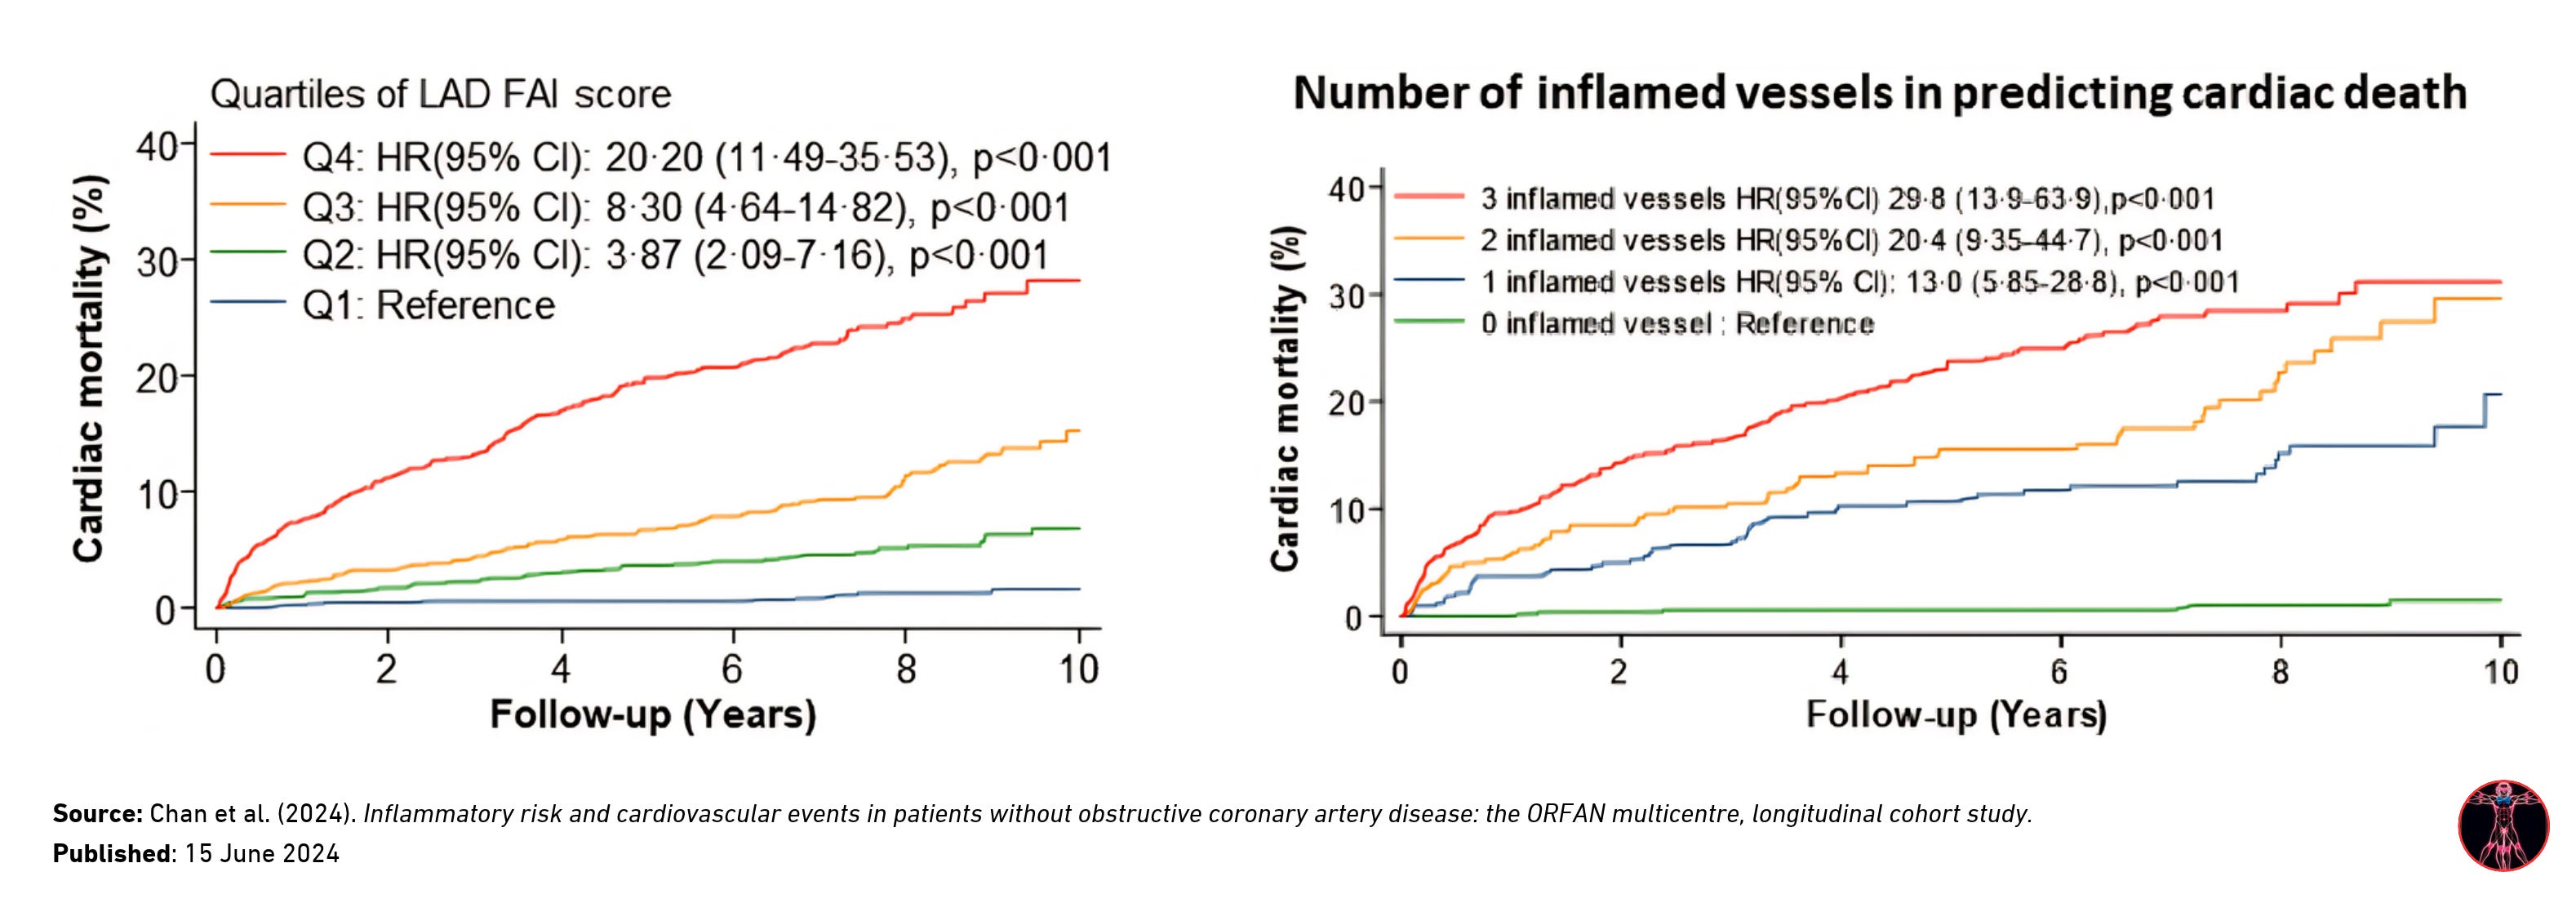
What it sees: Detects inflammation in arterial wall. Expressed as a Fat Attenuation Index (FAI) score & a 10-year cardiac mortality estimate.
Who it’s best for: Anyone already getting a CCTA. Useful if risk profile is worrying depsite little to no plaque present and willing to pay a premium.
Evidence: Those without significant blockages accounted for 66% of major cardiac events & 64% of cardiac deaths. High FAI & inflammation scores were both significant independent risk factors.
The FDA granted De Novo authorization in July 2026.

Shortfalls:
Limited availability → Brand new in the US as of late 2026.
Cost / radiation: $2,250—2,750 (through private cardiac clinics). Same radiation as CCTA.
#6: Opportunistic AI Calcium Scoring
What it sees: If you’ve had a lung screening, ER visit, or any chest CT scan in the past, a coronary calcium score can be read by AI after the fact.
Who it’s best for: Anyone who hasn’t done a deliberate calcium scan.
Evidence: Across 98 VA medical centers, an AI analysis of routine chest CTs correctly sorted zero vs. non-zero scores 89% of the time against typical CAC scans.
#7: CT-FFR (Fractional Flow Reserve from CT)
What it sees: Built from CCTA images showing blood flow through your coronaries & degree of narrowing.
Who it’s best for: Only people whose CCTA shows a moderate-to-severe narrowing. Irrelevant at the prevention stage.
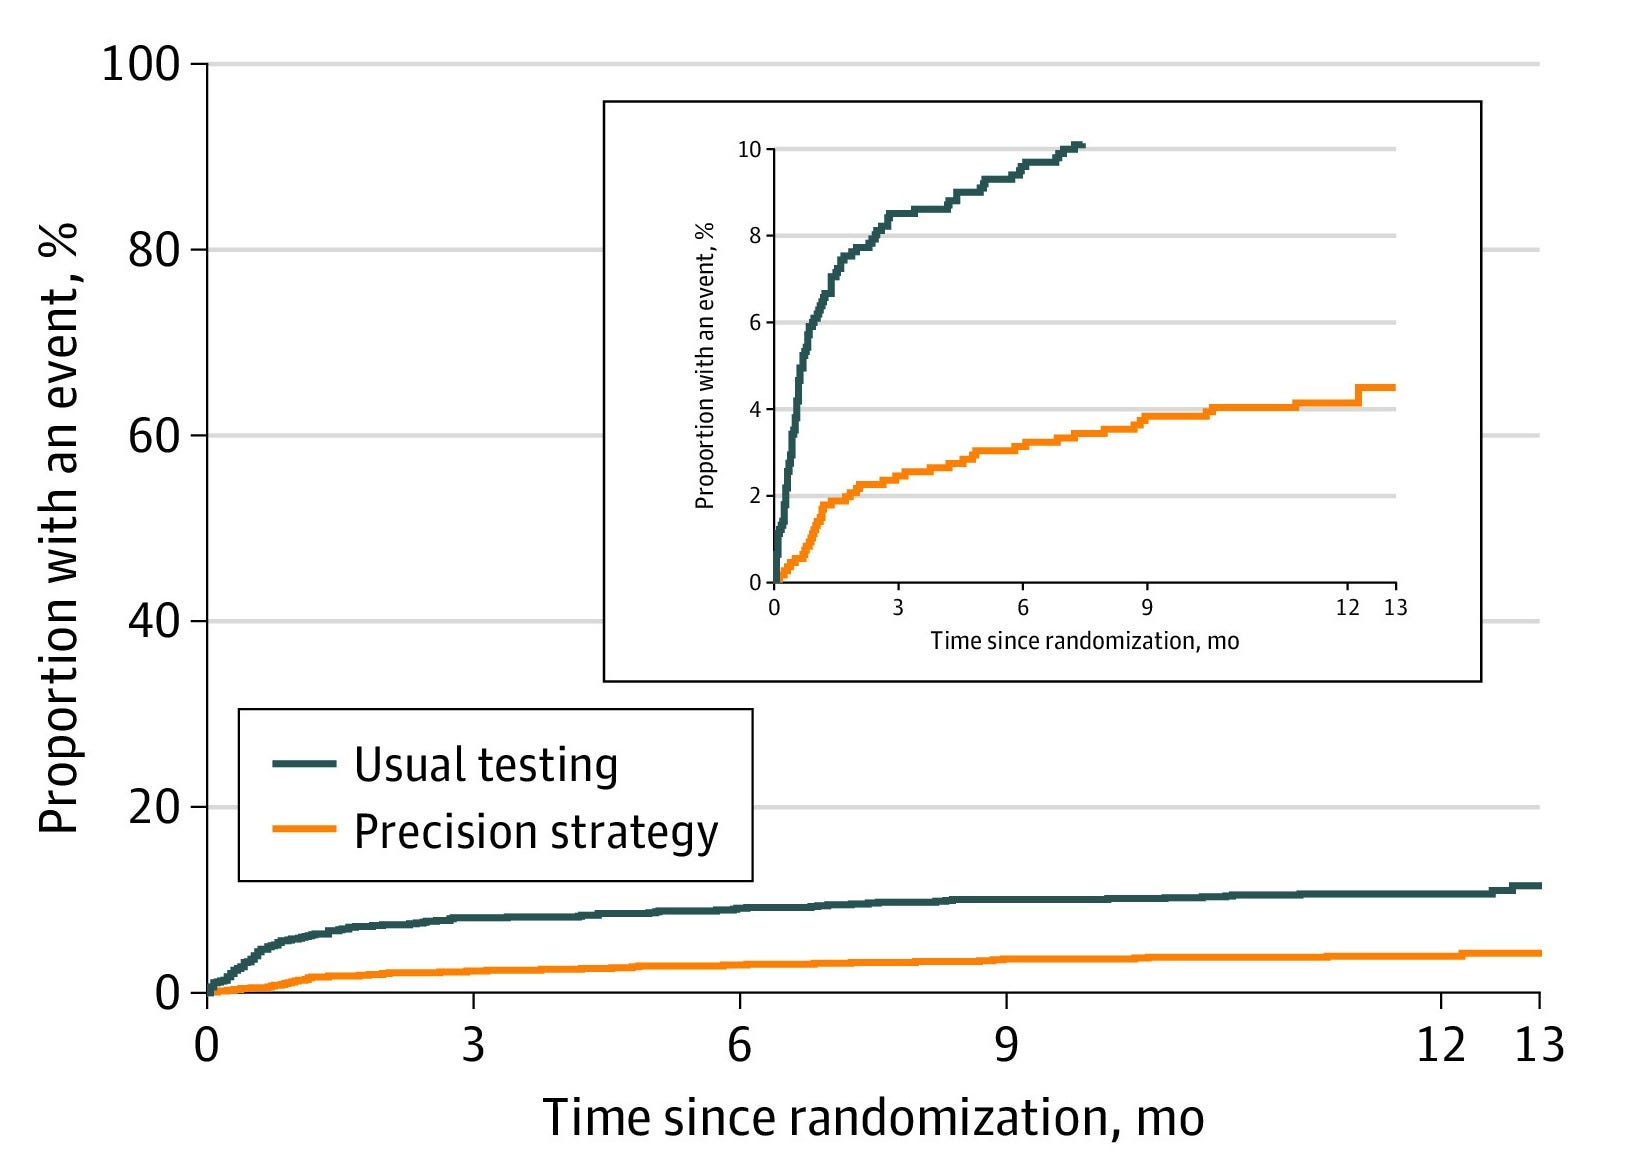
Evidence: A CT-FFR analysis cut catheterizations that found no significant blockage from 10.2% to 2.6% in the PRECISE trial.
Cost / radiation: $1,000-1,350. Same radiation as CCTA.
#8: Carotid Intima-Media Thickness (CIMT)
What it sees: Thickness of the inner lining of the carotid artery.
Who it’s best for: Few people today. Plaque ultrasound (#4) answers the more important question with the same tool.
Evidence: A meta-analysis of 14 studies & 45.8k people found CIMT adds limited value for predicting heart disease.
Shortfalls:
Thickening ≠ plaque → Usually a better of reflection of age & blood pressure rather than atherosclerotic plaque buildup.
Diminishing returns with bad reproducibility → Small measurement deltas can cause large margins of error.
Cost / radiation: $100–300 cash. No radiation.
#9: Stress Testing (Exercise ECG, Stress Echo, Nuclear)
What it sees: Whether a narrowing is severe enough to cut off blood flow to the heart under exertion.
Who it’s best for: Those with symptoms like chest pain or shortness of breath during light to moderate intensity movement.
Evidence: Most events don’t come from the flow-limiting blockages stress tests detect. Adults without significant narrowing accounted for two-thirds of major cardiac events. A plaque can be too small to fail a stress test and still rupture.
Shortfalls:
Blind to non-obstructive plaque → Misses the plaque causing most heart attacks.
Cost / radiation: $200–350 (ECG). $500—1,500 (Stress Echo). $1,200—3,000 (Nuclear). No radiation for exercise ECG or echo & ~10 mSv for nuclear.
Testing — Blood Markers (Part 2)
Most markers below come in a single draw through Superpower (who I’ve personally used for 2+ yrs now): ApoB, hs-CRP, HbA1c, fasting insulin, & the triglyceride/HDL ratio are all in the baseline panel. Lp(a) is available as an add-on (only needed once in lifetime).

#1: ApoB (Apolipoprotein B)
What it measures: The number of plaque-forming particles in the blood. Every LDL, VLDL, & Lp(a) particle carries exactly one ApoB. Particle number determines how many particles push into the artery wall.
Evidence: Across 389k people, heart attack risk was best captured by the number of ApoB particles.

ApoB also tends to beat out LDL-C as a marker. Where ApoB was higher than their LDL suggested, there was an 11% higher event risk & those running lower had 13% lower risk.

Functional Optimal Ranges
🟢 Optimal: < 60 mg/dL
🟡 Good: 60–74 mg/dL
🟠 Elevated: 75–89 mg/dL
🔴 High: ≥ 90 mg/dL
#2: Lp(a) (Lipoprotein(a))
What it measures: High genetically influenced, LDL-like particle with an extra protein attached. Makes the particle more likely to build plaque, promote clots, & inflame the artery wall.
Evidence: Emerging as an established, independent, causal risk factor, elevated in 20% of people. A 75 study & 957k person meta-analysis found that each 50 mg/dL increase in Lp(a) carried 31% higher risk of CVD.

Functional Optimal Ranges
🟢 Optimal: < 30 mg/dL (< 75 nmol/L)
🟡 Good: 30 - 50 mg/dL (75 - 125 nmol/L)
🟠 At Risk: 50 - 80 mg/dL (125 - 200 nmol/L)
🔴 High Risk: > 80 mg/dL (> 200 nmol/L)
#3: hs-CRP (High-Sensitivity C-Reactive Protein)
What it measures: A protein the liver releases in response to inflammation anywhere in the body.
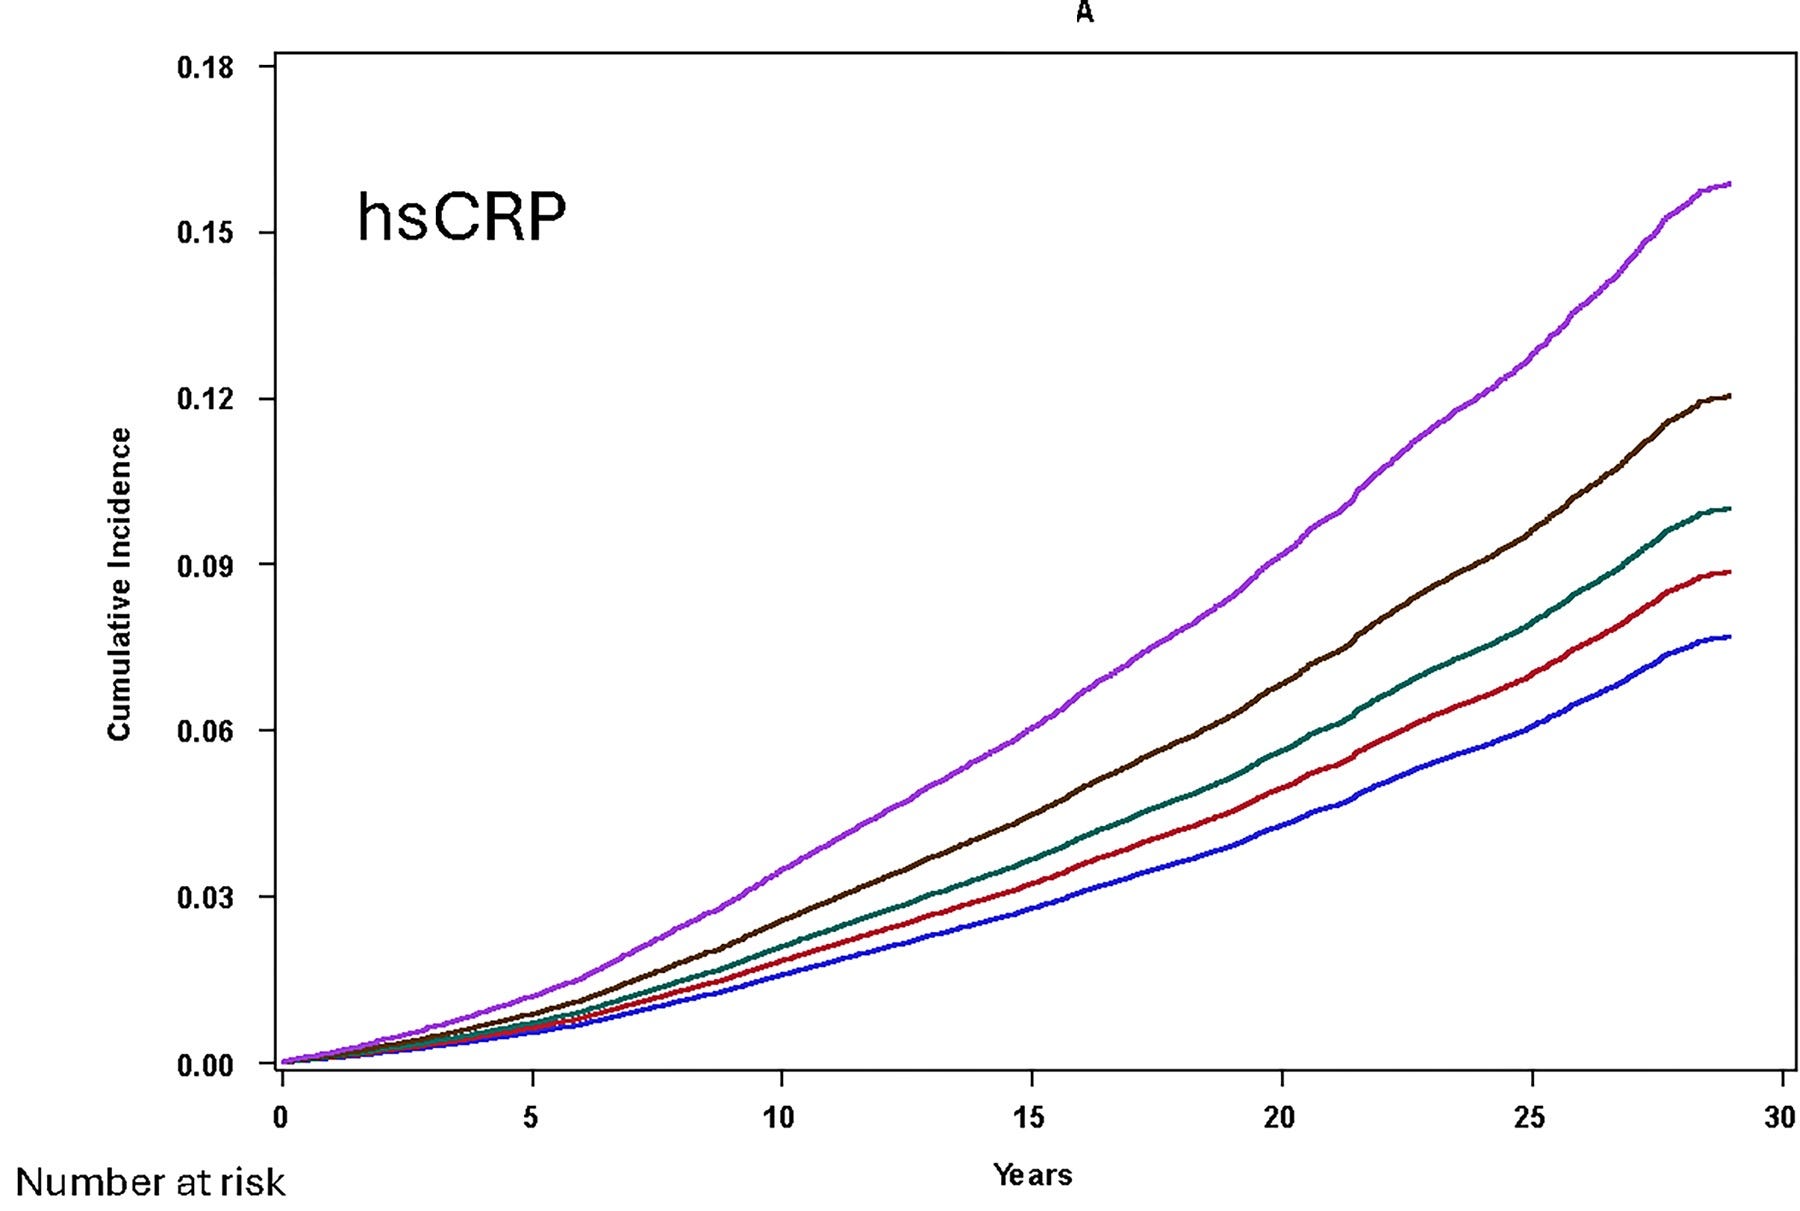
Evidence: ~28k tracked for over 30 years, those with the highest hs-CRP had 70% greater risk of a major cardiovascular event → a stronger signal than LDL or Lp(a).
Functional Optimal Ranges
🟢 Optimal: < 0.5 mg/L
🟡 Good: 0.5-1.0 mg/L
🟠 At Risk: 1.0-3.0 mg/L
🔴 High Risk: > 3.0 mg/L
#4: HbA1c (Hemoglobin A1c)
What it measures: Average blood sugar over last 3 months.
Evidence: Across ~4k middle-aged adults without diabetes, HbA1c tracks with plaque burden in a linear way.
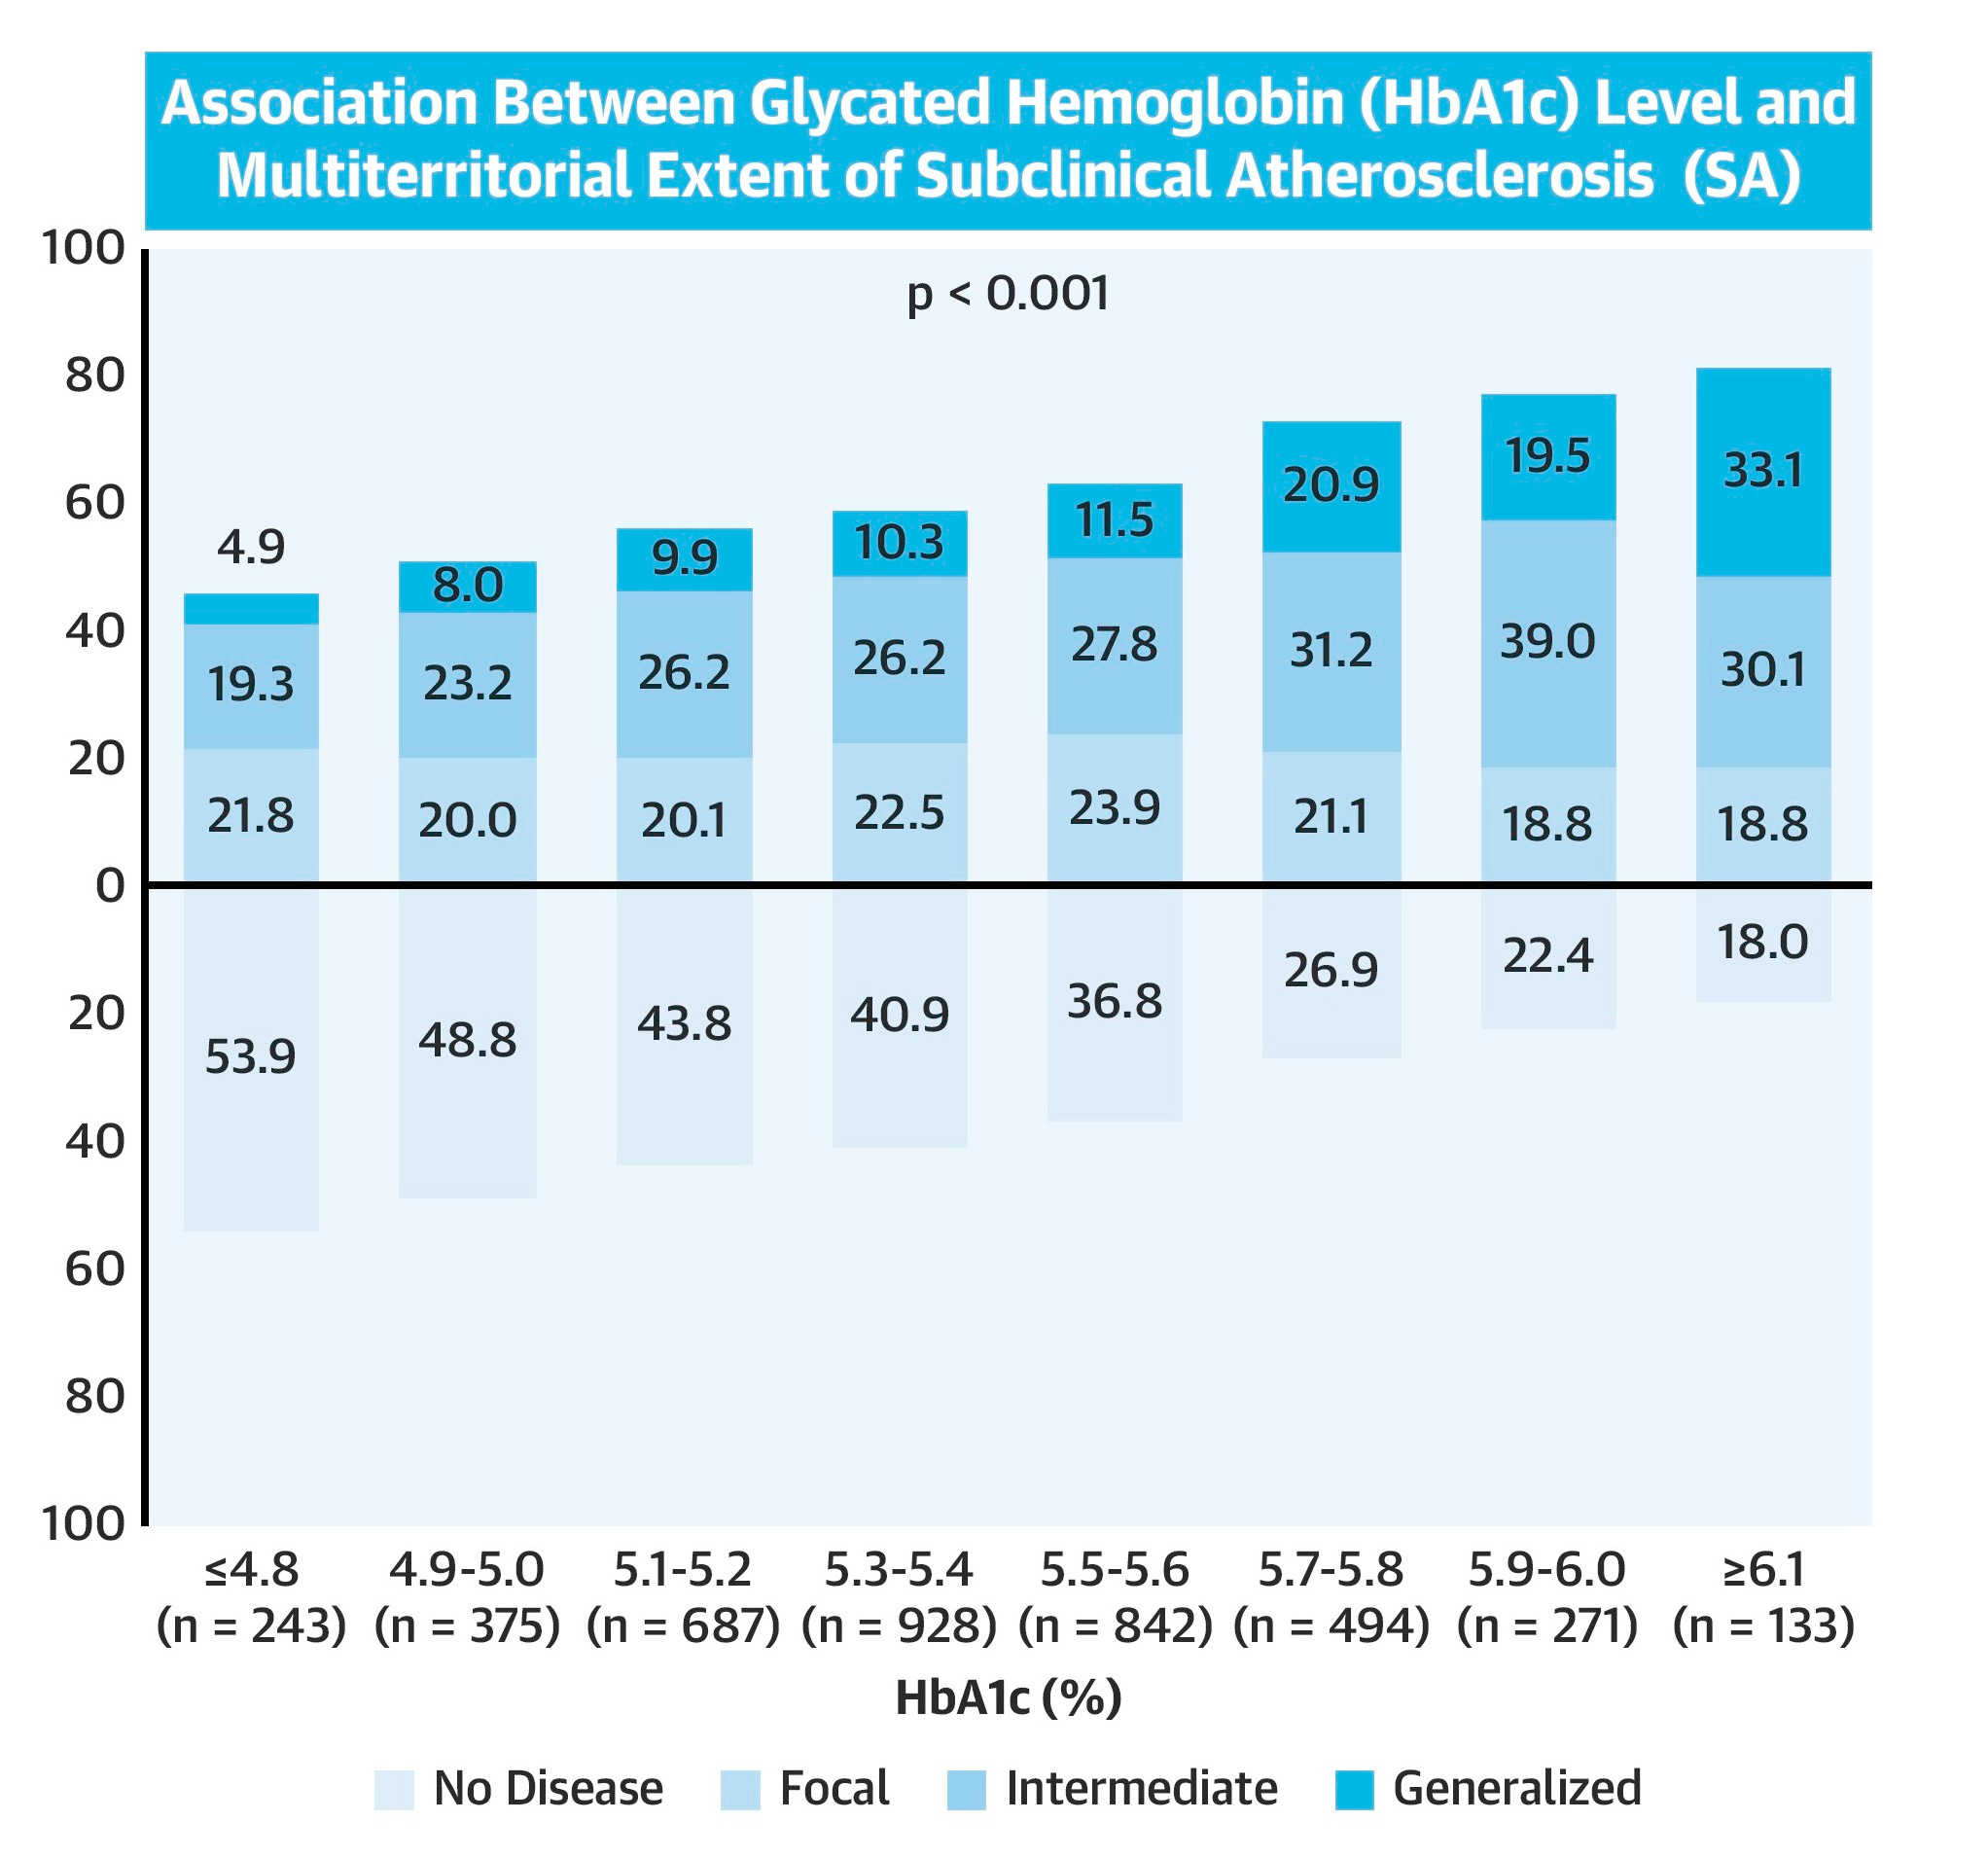
At 5.5–5.6%, odds of more widespread plaque were 36% higher than in people below 5.0%. Fasting glucose showed no association with plaque at all.
Functional Optimal Ranges
🟢 Optimal: 4.6–5.3%
🟡 Good: 5.4–5.6%
🟠 Prediabetic: 5.7–6.4%
🔴 Diabetic: > 6.4%
#5: HOMA-IR
What it measures: An insulin resistance metric combining fasting insulin & glucose.
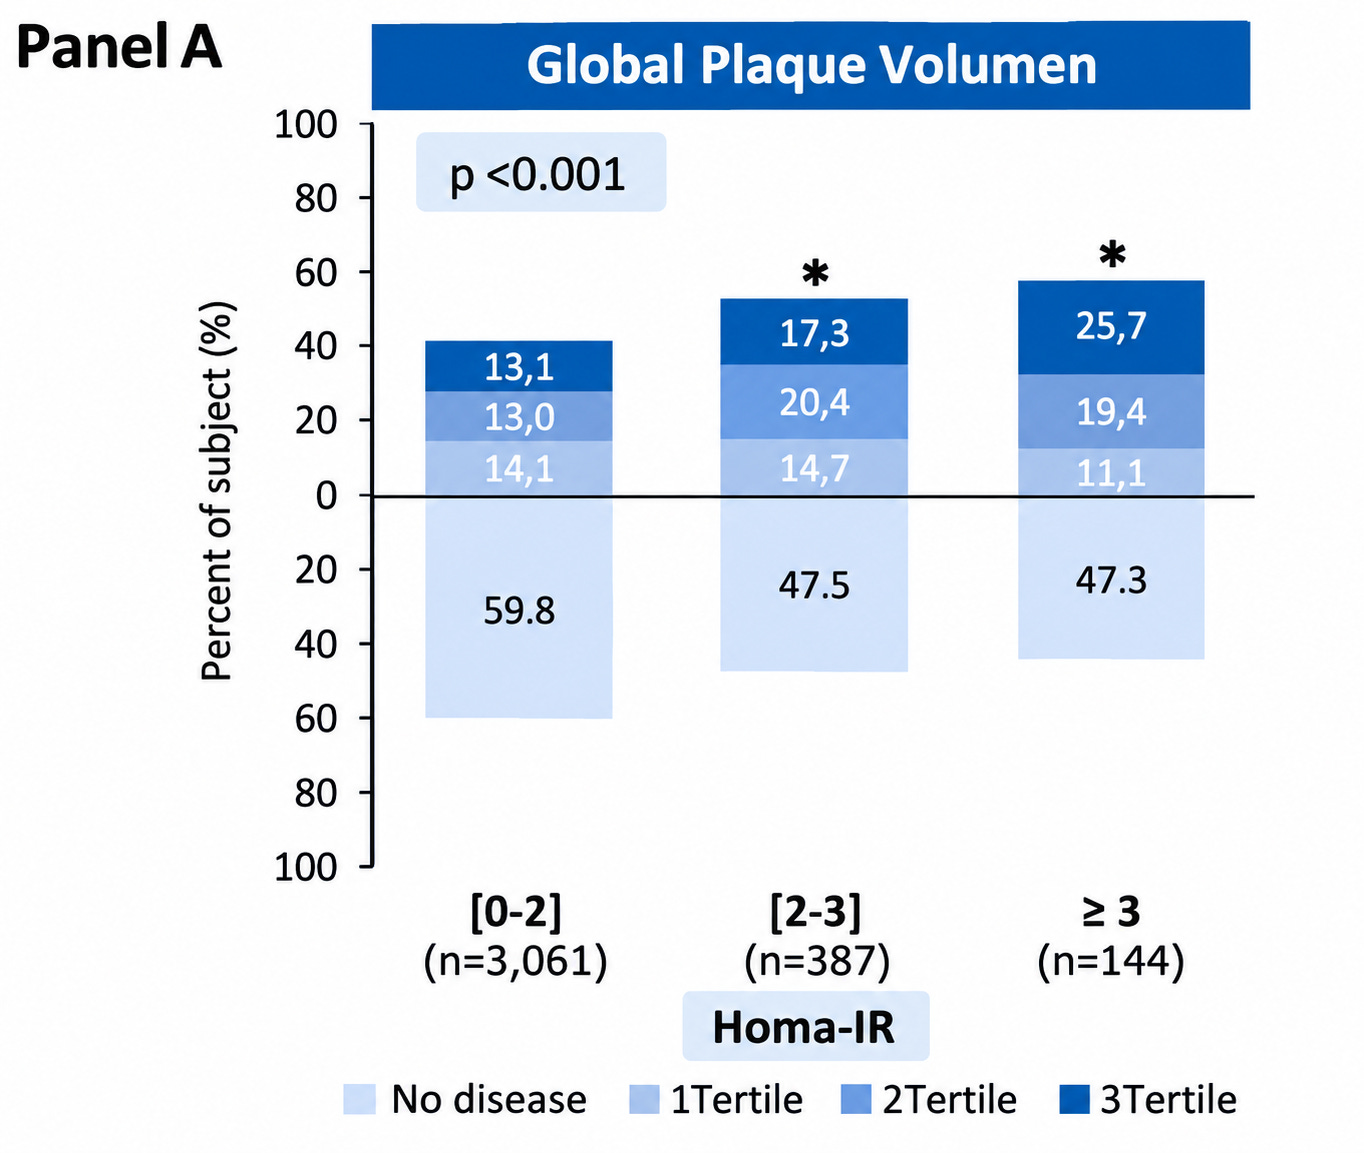
Evidence: Across 3.7k middle-aged adults with HbA1c < 6.0%, a HOMA-IR of 3 or higher was linked to 74% higher odds of a CAC above 0 & 41% higher odds of plaque across multiple arteries.
Functional Optimal Ranges
🟢 Optimal: < 1.0
🟡 Good: 1.0–1.5
🟠 Early insulin resistance: 1.6–2.4
🔴 Insulin resistant: > 2.4
#6: Triglyceride/HDL Ratio
What it measures: An early status check of leptin & insulin sensitivity. Shows a shift toward smaller, more numerous particles.
Evidence: Among those with higher ApoB than their predicted LDL, triglyceride-rich particles accounted for about 25% of the excess risk.
Functional Optimal Ranges
🟢 Optimal: < 1
🟡 Good: 1 - 2
🟠 At Risk: 2 - 3
🔴 High Risk: > 3
#7: Oxidized LDL (OxLDL)
What it measures: LDL particles damaged by oxidation. Immune cells in the artery wall engulf oxLDL and become the “foam cells” that are early plaque.
Evidence: Highest levels of carried 67% higher odds of coronary events.
Functional Optimal Ranges
🟢 Optimal: < 45 U/L
🟡 Good: 45–60 U/L
🟠 Elevated: 61–75 U/L
🔴 High: > 75 U/L
I covered the other 14 markers here:

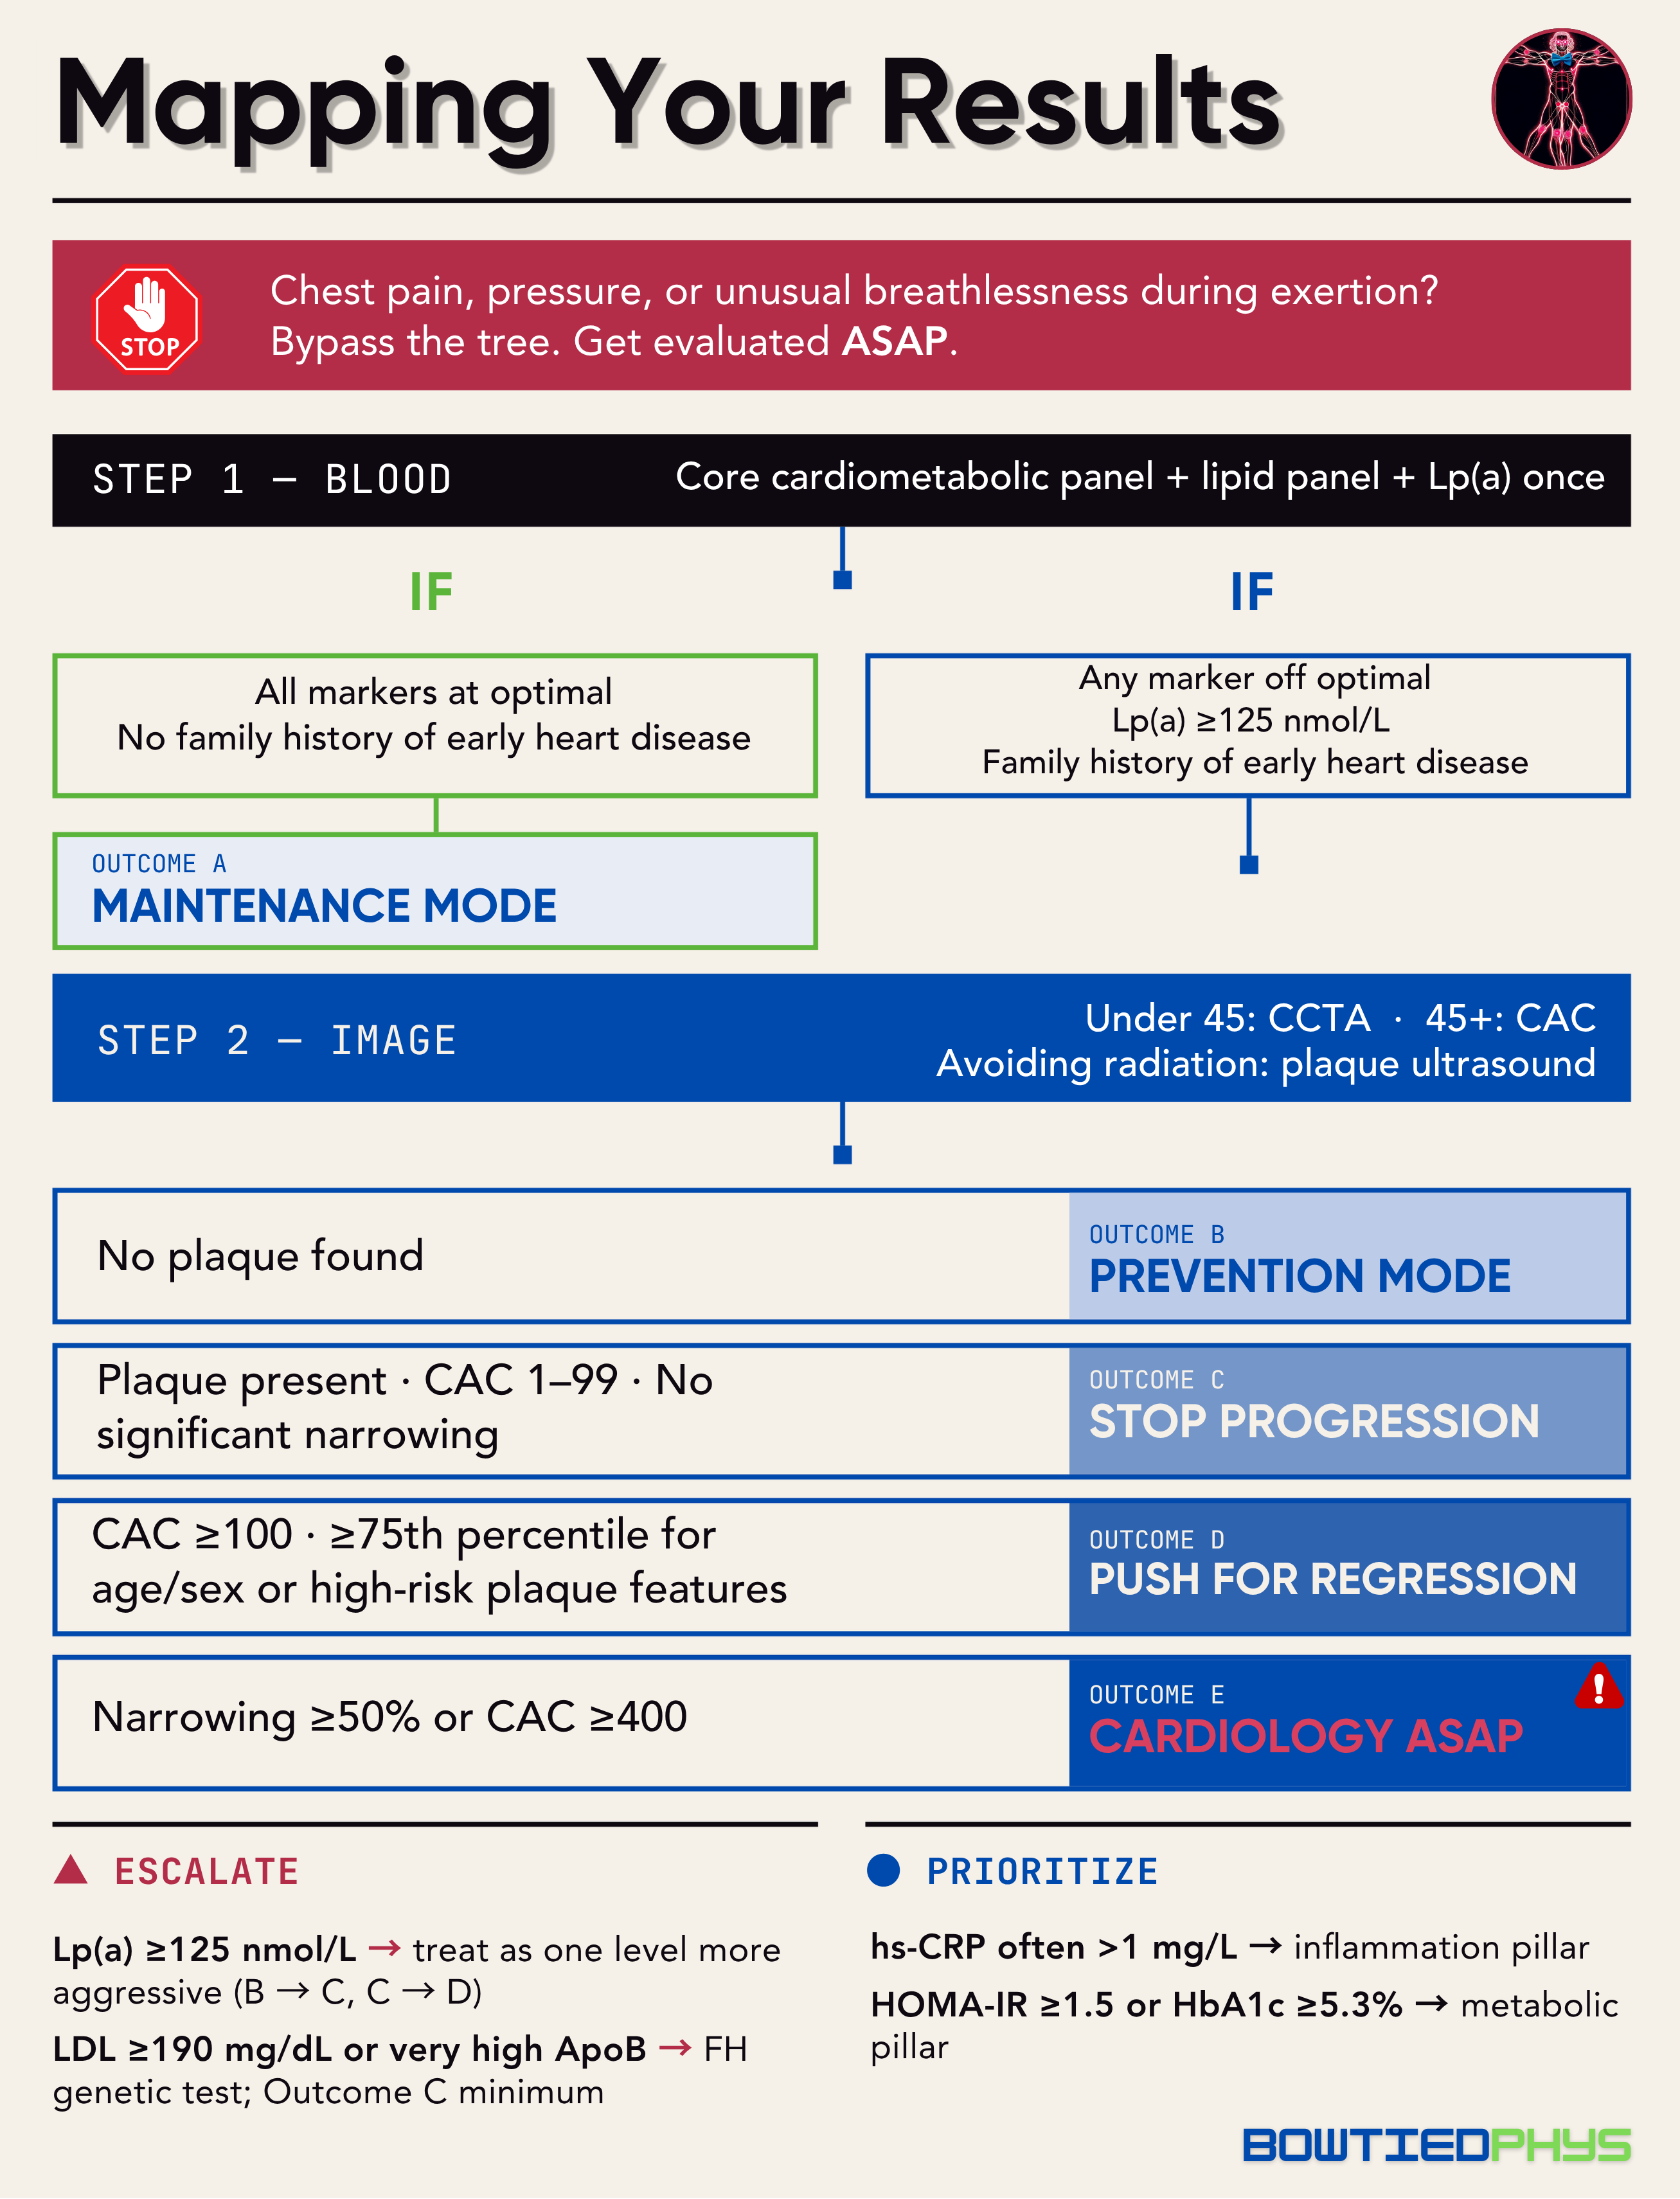
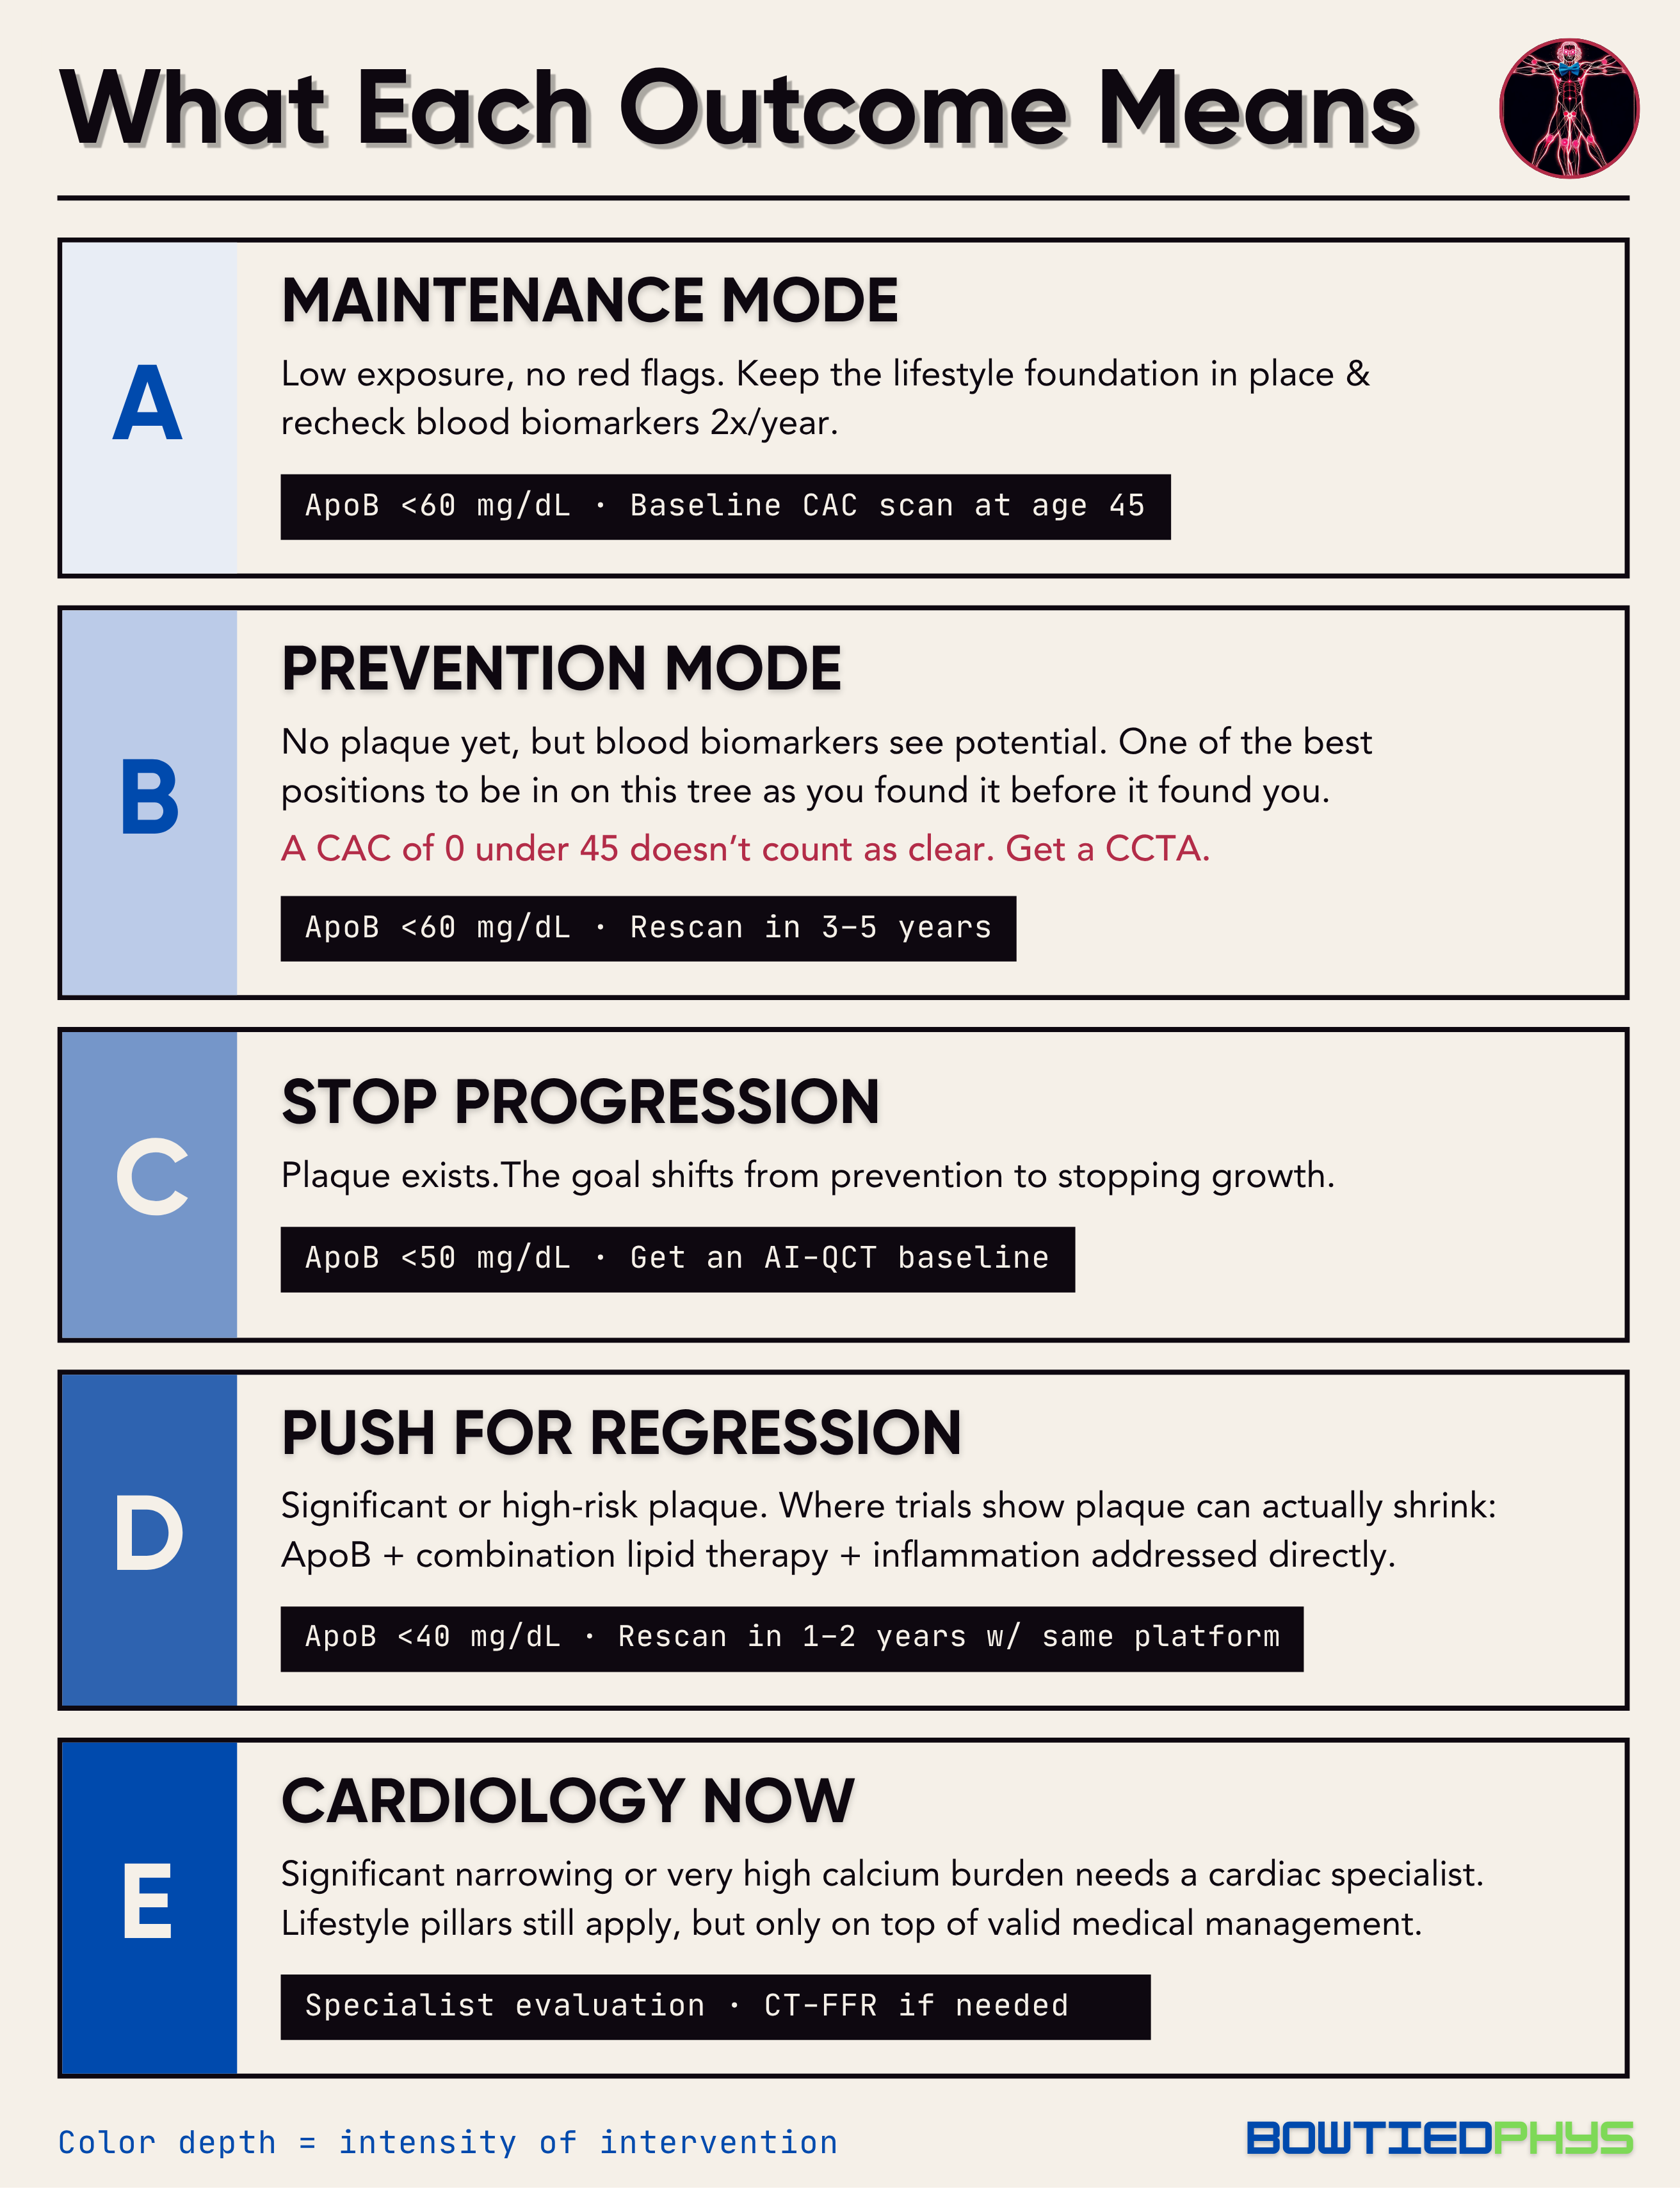
Building Your Cardiovascular Protection Strategy
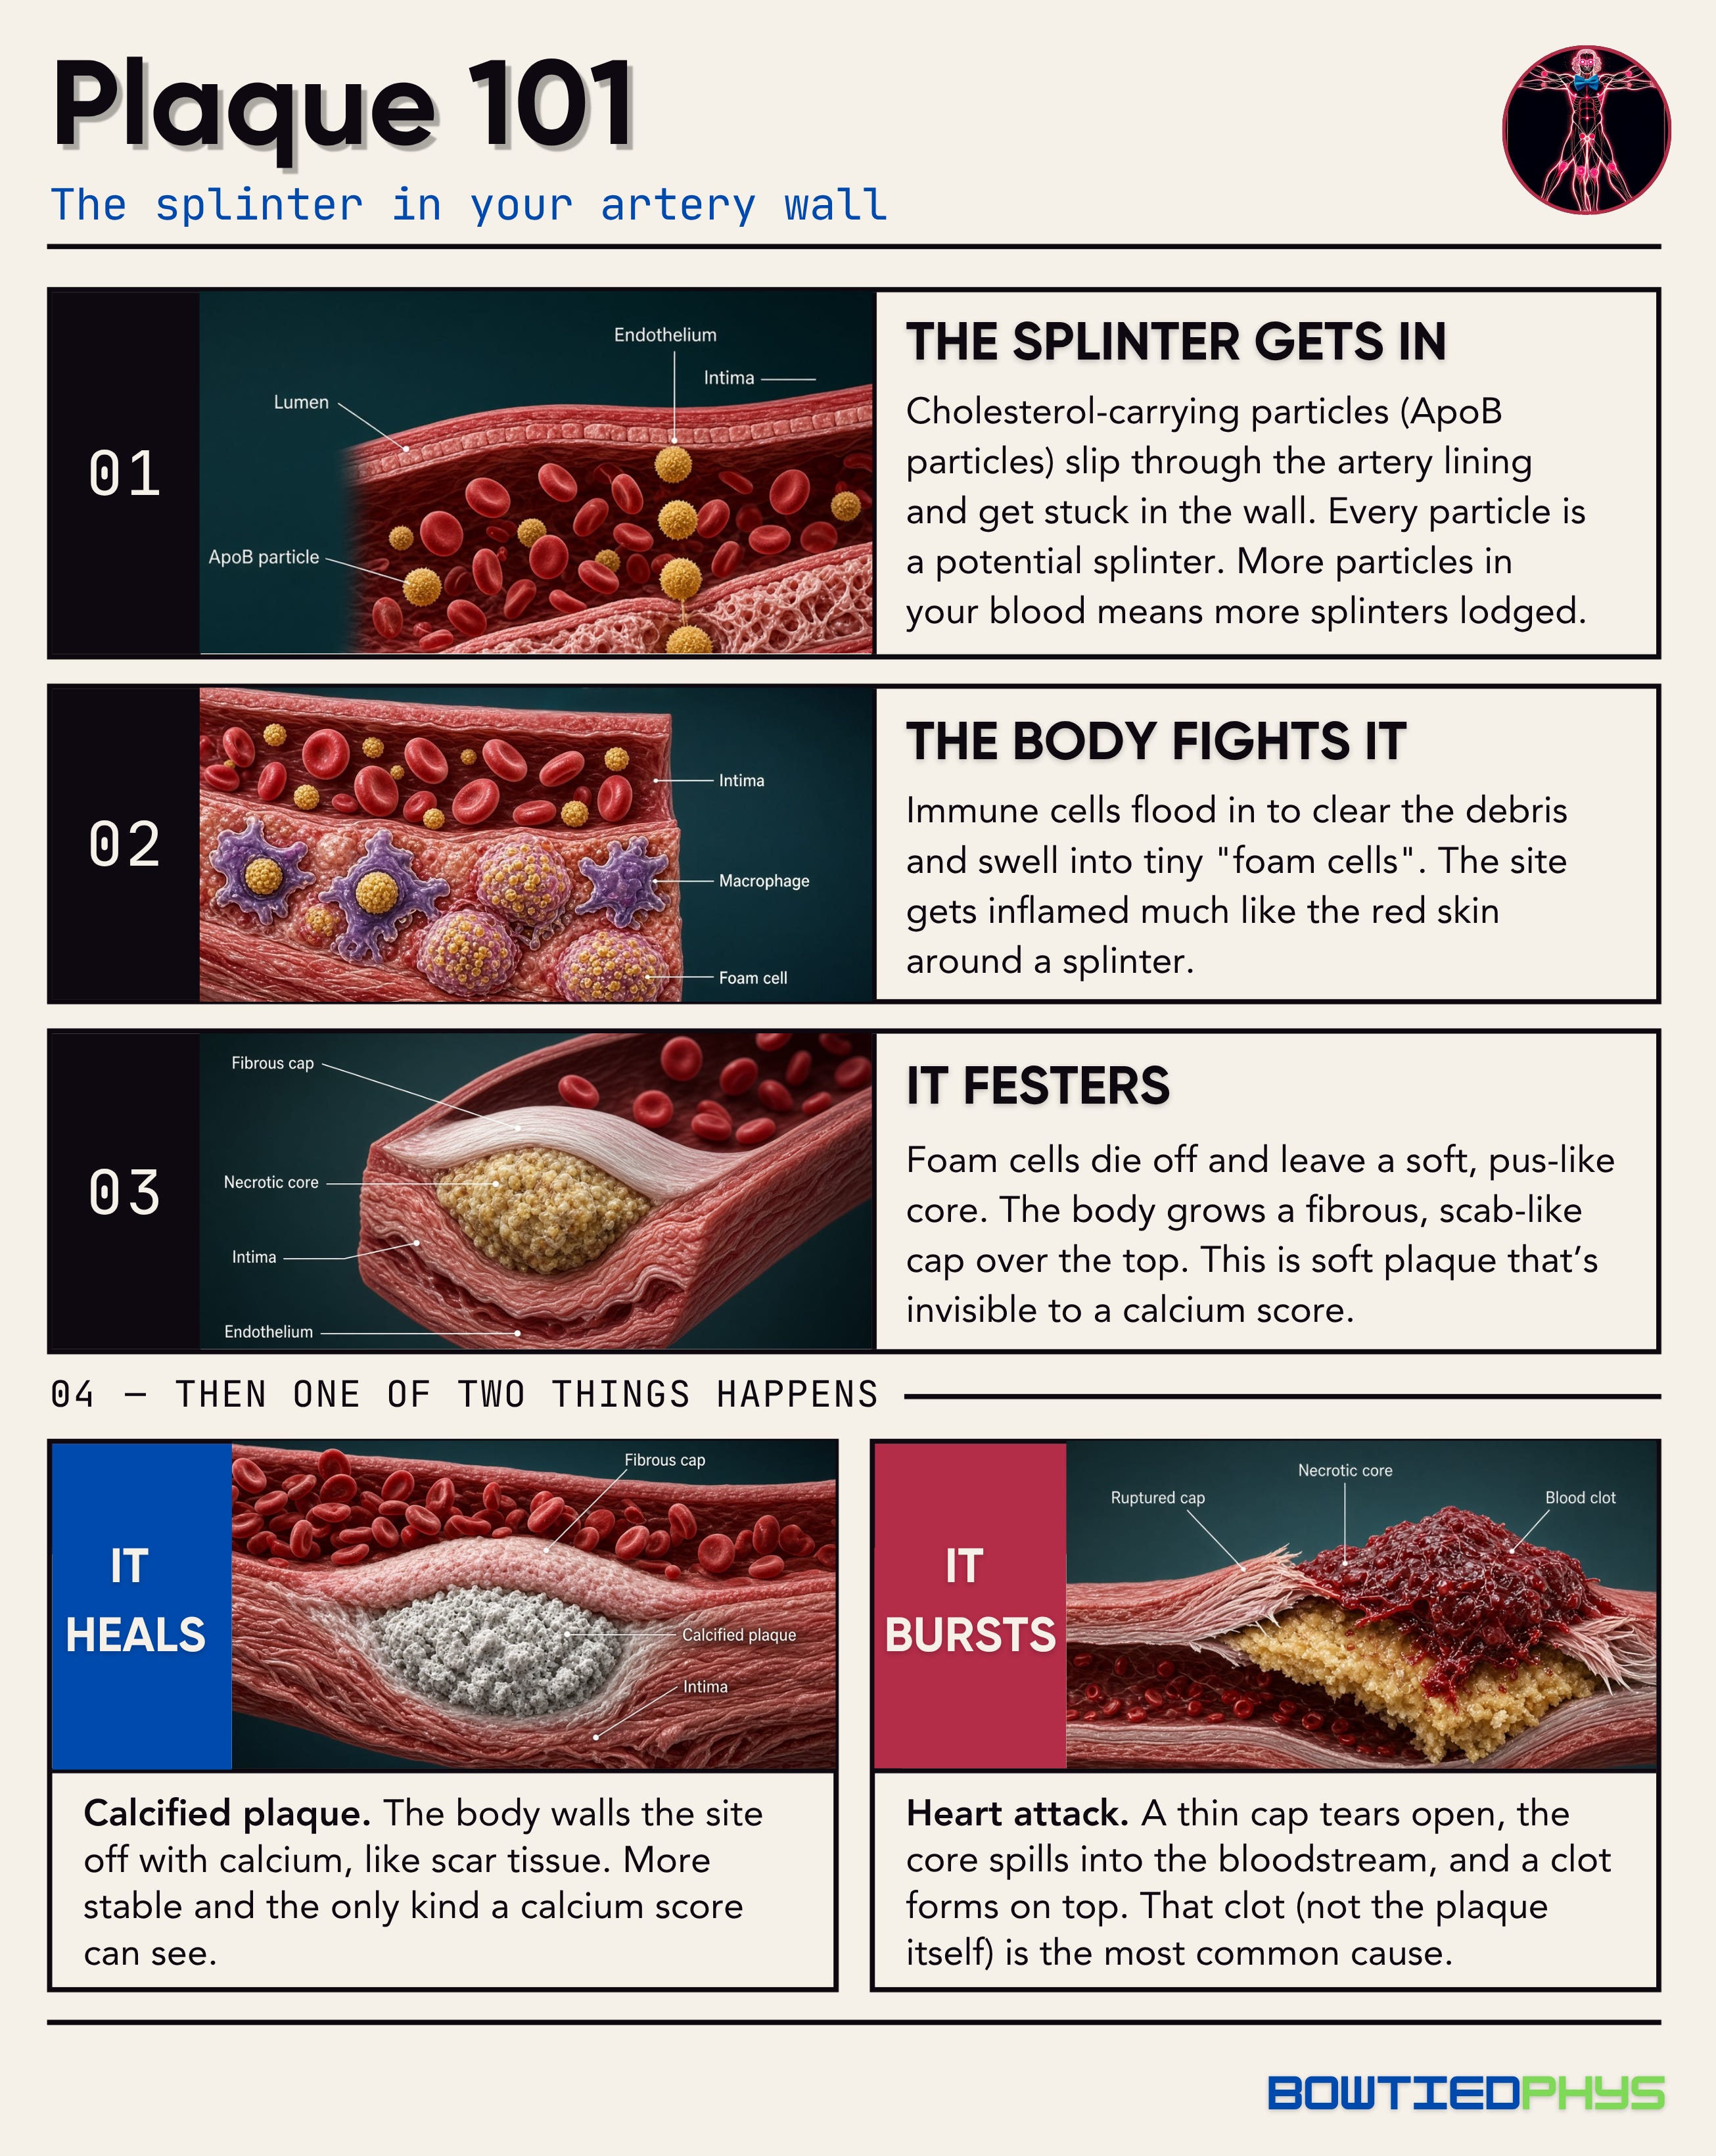
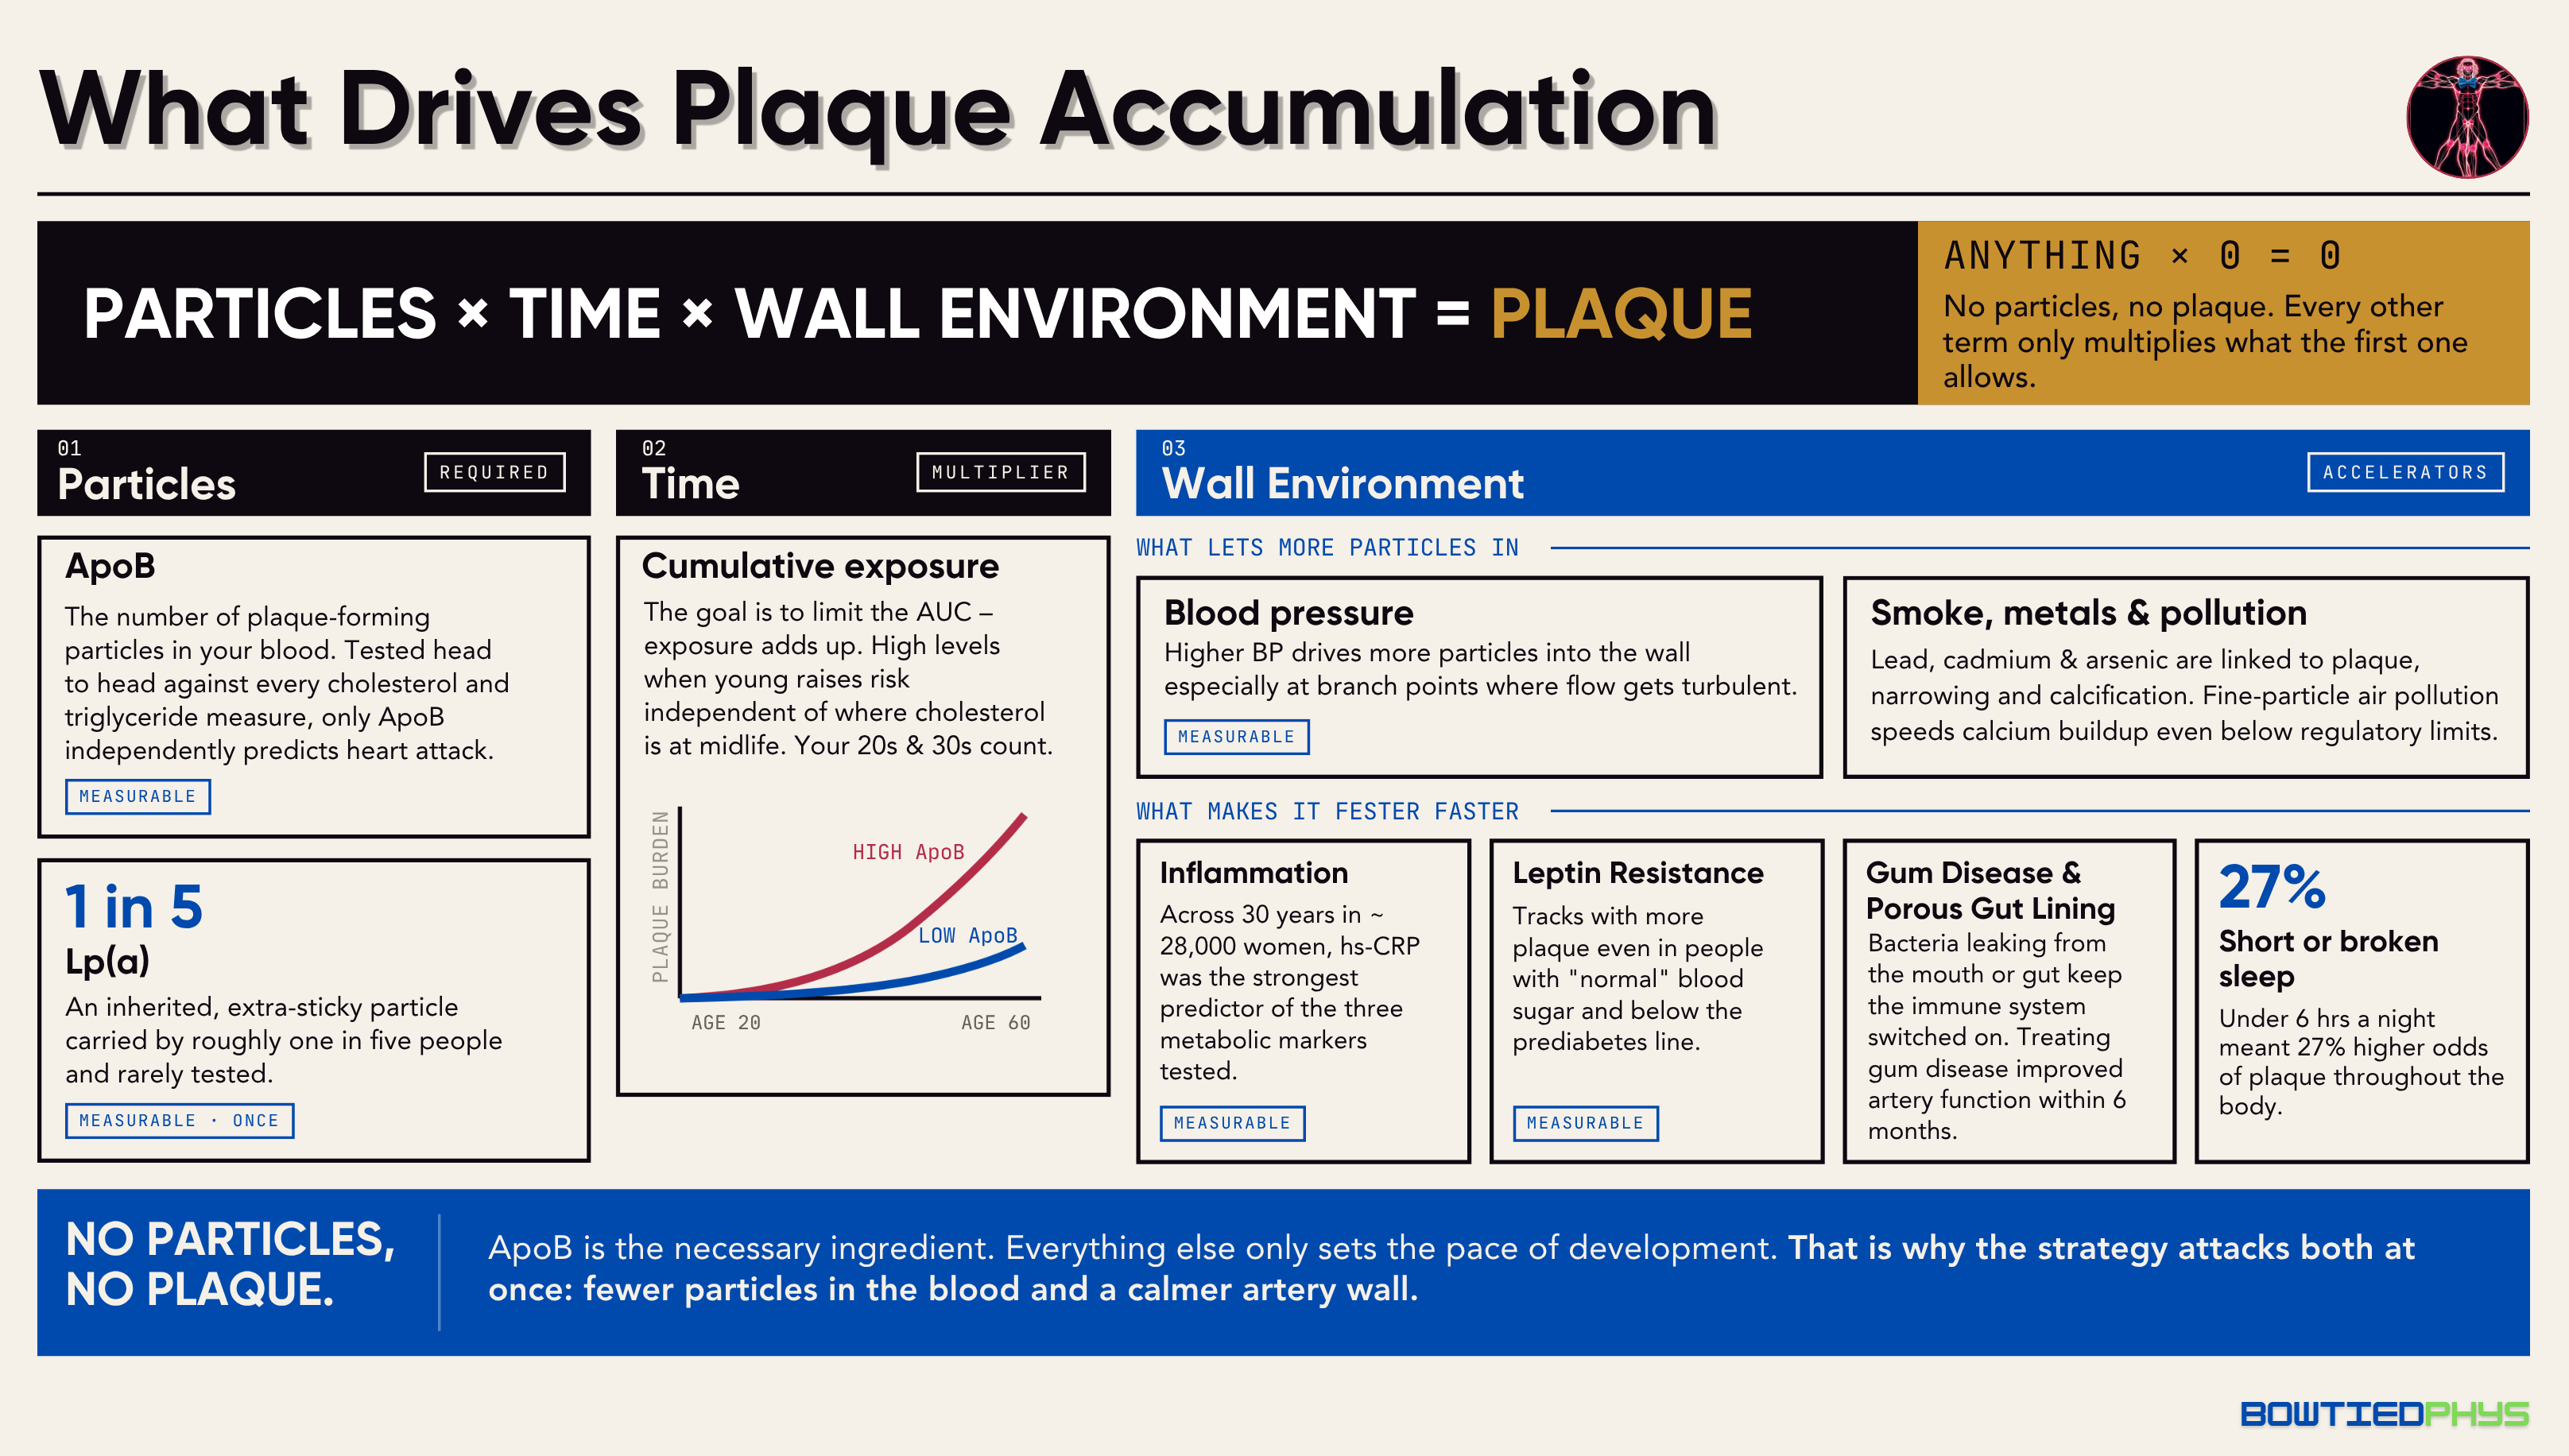
Return back to what we stated in Plaque 101 above → plaque needs two things to survive: 1) particles to get into the artery wall (ApoB) & a 2) wall environment that afford them the chance to cause blockages (inflammation + metabolic dysfunction + toxic exposures).

