

My CGM Experiment
A true n = 1 experiment: Eating like an a**hole. Invalidating dogma. Testing glycemic reduction methods.

In early May, I picked up a Dexcom G7 - continuous glucose monitor (CGM) - and conducted a series of experiments identifying methods to decrease the peak of blood glucose response/decrease the magnitude of the gradient (both rise & fall). While we were at it, I decided to debunk some popular myths surrounding the topics of glycemic responses with certain diets.
Before I detail my personal experiences, we need to understand some of the very basics on blood glucose.
What is blood glucose?
Blood glucose, more colloquially referred to as blood sugar, is the body’s primary source of energy for its cells. Chemically, it’s a monosaccharide with the formula C6H12O6 circulating in the bloodstream.
Two key hormones tied to the transport of glucose in the body are insulin & glucagon:
Insulin, produced by the pancreas, facilitates glucose uptake from blood into cells for energy production or storage as glycogen.
Glucagon promotes the release of glucose from liver glycogen stores when levels are low.

The brain relies heavily on glucose as its main energy source - 60% of blood glucose consumed by the brain in a fasted state.
Our body has such a desire for glucose it converts even non-carbohydrate sources to glucose via a process called gluconeogenesis.
How does a continuous glucose monitor work?
Typically when I think of glucose measurement, I think of the more traditional finger-prick tests. However, measurement tools today have gotten far more advanced.
CGMSs are made up of two primary components: sensor & transmitter.
The sensor gets inserted just under the skin, typically in the back of the arm area. The sensor contains an enzyme - glucose oxidase - that interacts with the glucose molecules present in the interstitial fluid and is designed to measure glucose levels every 5 minutes. This interaction generates an electrical signal proportional to the glucose concentration.
The sensor is connected to a transmitter that sits on the skin's surface. The transmitter sends the glucose data via radio frequency or Bluetooth to a receiver device - in my case the Dexcom mobile app.
The CGM I used was a Dexcom G7. My experience with it was phenomenal - easy to use, great user interface via the mobile app, and painless to input into my left tricep. Anyone who is considering running a 10-day test with one, I’d highly recommend this particular brand and model.
Alright - enough of the nerd talk. Let’s jump into my experiences below.
My Experiences
Day 1: Carb Variation
After applying the patch on Tuesday late afternoon, I allowed the CGM to get an initial reading and regulate any readings for the first 12 hours.
Waking up the next day (5:30 AM), I was fasted at this point for about 12 hrs. Off to the gym for Zone 2 cardio day. After a 30-min session, my BG dropped from ~95 mg/dL to 80 mg/dL. Shortly after I stepped into the dry sauna for a 30-min session. After exiting the sauna, my BG normalized to 100.
Day 1 intent = show deltas in glycemic response with no postprandial activity across 3 different carbohydrates: oatmeal, white rice, & white potatoes
(3) 120 g carb meals in a refeed day (high carb, minimal fat + protein, no supplementation)
1) OATMEAL
Post completion of Zone 2 + sauna → 88 mg/dL
Pre meal → 95 mg/dL
Peak of glucose response → 151 mg/dL
Post meal trough → 90 mg/dL
Pre meal to Peak (% change) → + 59%
Peak to Post (% change) → - 41%

2) WHITE RICE
Pre meal → 105 mg/dL
Peak of glucose response → 178 mg/dL
Post meal trough → 75 mg/dL
Pre meal to Peak (% change) → + 69%
Peak to Post (% change) → - 58%

3) WHITE POTATOES
Pre meal → 95 mg/dL
Peak of glucose response → 149 mg/dL
Post meal trough → 71 mg/dL
Pre meal to Peak (% change) → + 57%
Peak to Post (% change) → - 52%

Highlights from Day 1:
Greatest glycemic response = white rice
White potatoes & oatmeal showed similar glycemic responses in equal amounts
White potatoes have the highest glycemic index, but the amount of cooling after cooking may have played a role in reduced glycemic response
Day 2: Postprandial Movement
Day 2 intent = show difference in glycemic response between postprandial walk vs. no activity
1) OATMEAL W/ POSTPRANDIAL WALK
Pre meal → 93 mg/dL
Peak of glucose response → 113 mg/dL
Post meal trough → 75 mg/dL
Pre meal to peak (% change) → + 22%
Peak to trough (% change) → - 34%
Time from pre to peak → 25 min
Time from peak to trough → 20 min

How does this compare to the same meal without postprandial walk (conducted on Day 1)?
Peak of glucose response = - 38 mg/dL
Time from pre to peak = 15 min faster
Time from peak to trough = 5 min faster
Relative to Day 1's same meal without postprandial activity, the movement after meal instance showed a faster, but much smaller peak glucose response.
2) WHITE RICE W/ POSTPRANDIAL WALK
Pre meal → 95 mg/dL
Peak of glucose response → 127 mg/dL
Post meal trough → 75 mg/dL
Pre meal to peak (% change) → + 34 %
Peak to post (% change) → - 40%
Time from pre to peak → 35 min
Time from peak to trough → 35 min

3) WHITE RICE W/O POSTPRANDIAL WALK
Pre meal → 107 mg/dL
Peak of glucose response → 165 mg/dL
Post meal trough → 75 mg/dL
Pre meal to peak (% change) → + 54%
Peak to post (% change) → - 54 %
Time from pre to peak → 35 min
Time from peak to trough → 35 min

How does the movement after meal compare to non-movement?
Peak of glucose response = - 38 mg/dL
Time from pre to peak = no significant change
Time from peak to trough = no significant change
Highlights from Day 2:
Smaller peak glucose responses show you need to be moving after meals for at least 20 min
Note on the 3rd scenario w/o postprandial movement → in the brief moments following the peak glucose response, you'll notice a slight dip. At that time, I started to do some household chores for ~10 min (i.e. take trash out, carry some items to my car). Once I sat back down, I got another rise to what eventually became the peak. This further supports a minimum of 20 min of post-meal activity.
Day 3: Berberine
Day 3 intent = show difference in glycemic response between 500 mg berberine 30 min before meal vs. control
1) OATMEAL W/ BERBERINE
Pre meal → 92 mg/dL
Peak of glucose response → 115 mg/dL
Post meal trough → 63 mg/dL
Pre meal to peak (% change) → + 25%
Peak to trough (% change) → - 45%
Time from pre to peak → 25 min
Time from peak to trough → 30 min

How does this compare to the same meal without berberine or postprandial walk?
Peak of glucose response = - 36 mg/dL
Time from pre to peak = no significant change
Time from peak to trough = 15 min slower
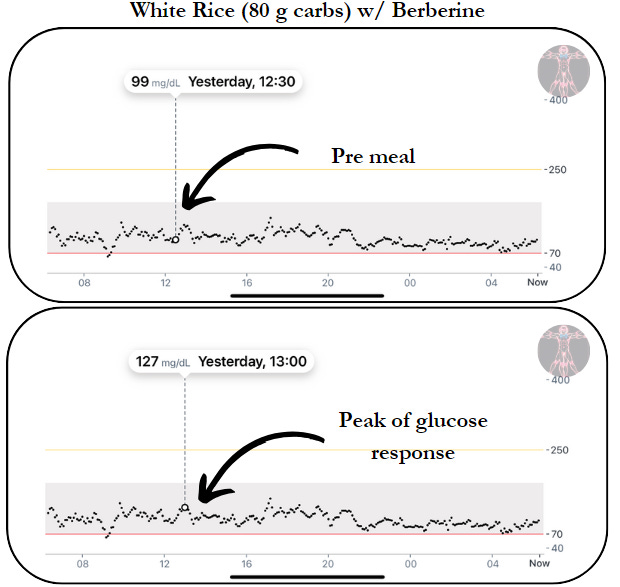
2) WHITE RICE W/ BERBERINE
Pre meal → 99 mg/dL
Peak of glucose response → 127 mg/dL
Post meal trough → 86 mg/dL
Pre meal to peak (% change) → + 28%
Peak to post (% change) → - 32%
Time from pre to peak → 30 min
Time from peak to trough → 30 min
How does this compare to the same meal without berberine or postprandial walk?
Peak of glucose response = - 51 mg/dL
Time from pre to peak = no significant change
Time from peak to trough = no significant change
Highlights from Day 3:
500 mg of berberine taken prior to these meals showed a substantial reduction in peak blood glucose
Both meals supplemented with berberine showed nearly identical results to a postprandial walk
The combination of berberine & postprandial activity can be a synergistic way of controlling post-meal blood glucose spikes
Day 4: High Intensity Interval Training (HIIT)
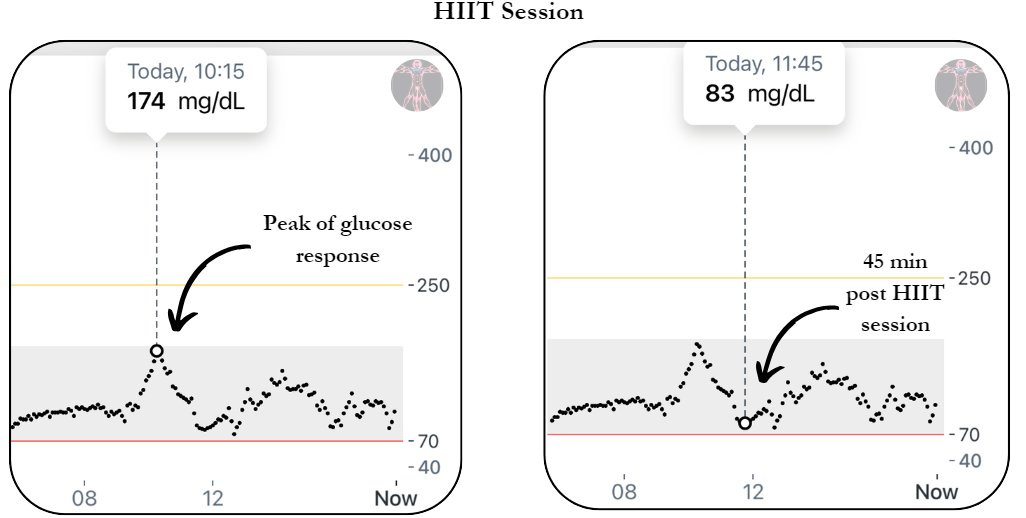
Day 4 intent = review the impact of high intensity interval training (8 x 400 m sprints) on blood glucose levels
Pre HIIT → 92 mg/dL
Peak of glucose response → 174 mg/dL (highest in experiment thus far)
Post HIIT trough → 83 mg/dL
Pre meal to peak (% change) → + 89%
Peak to trough (% change) → - 52%
Why does HIIT acutely increase blood glucose levels?
HEPATIC GLUCOSE PRODUCTION
1) Glycogenolysis → ATP resynthesis
Catecholamine stimulation: Epinephrine + norepinephrine released → activates β-adrenergic receptors → activation of glycogen phosphorylase → breakdown of glycogen to glucose-1-phosphate
Calcium Signaling: Catecholamines activate α-adrenergic receptors on hepatocytes → increases in intracellular calcium levels → stimulates glycogenolysis → elevated blood glucose
2) Gluconeogenesis → glucose from non-carb sources
Lactate Metabolism: Anaerobic glycolysis spikes → elevated lactate production in muscles → lactate to liver → used as substrate for gluconeogenesis → increased glucose output
Transcriptional Regulation: Increased glucagon + cortisol levels → upregulates the expression of gluconeogenic enzymes (G6P & PEPCK) → spike in blood glucose
Highlights from Day 4:
HIIT significantly increases blood glucose levels via hepatic glucose production (glycogenolysis + gluconeogenesis)
Day 5: Ceylon Cinnamon
+ LEG DAY
+ ACUTE STRESS RESPONSE
Day 5 intent = show difference in glycemic response between 2 Tbsp Ceylon cinnamon (mixed with water) 30 min before meal vs. control + impact of a lower day training session + stressful event
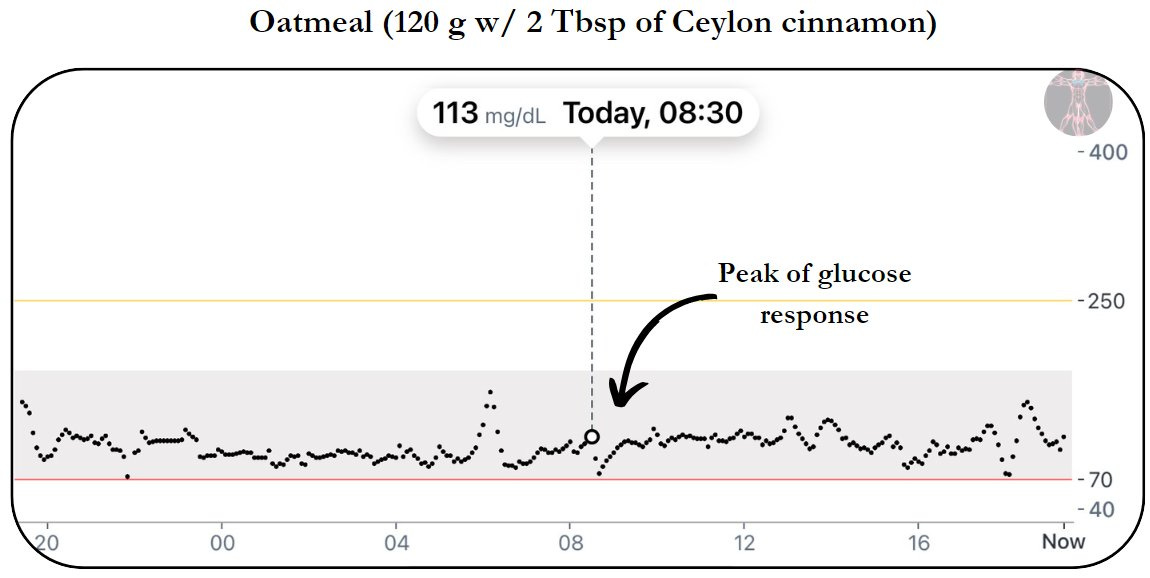
1) OATMEAL W/ CEYLON
Pre meal → 90 mg/dL
Peak of glucose response → 113 mg/dL
Post meal trough → 72 mg/dL
Pre meal to peak (% change) → + 26%
Peak to trough (% change) → - 36%
Time from pre to peak → 20 min
Time from peak to trough → 10 min
How does this compare to the same meal without Ceylon cinnamon or postprandial walk?
Peak of glucose response = - 38 mg/dL
Time from pre to peak = - 5 min
Time from peak to trough = + 5 min
2) WHITE RICE W/ CEYLON
Pre meal → 95 mg/dL
Peak of glucose response → 132 mg/dL
Post meal trough → 102 mg/dL
Pre meal to peak (% change) → + 39%
Peak to post (% change) → - 22.7%
Time from pre to peak → 20 min
Time from peak to trough → 30 min

How does this compare to the same meal without Ceylon cinnamon or postprandial walk?
Peak of glucose response = - 46 mg/dL
Time from pre to peak = no significant change
Time from peak to trough = no significant change
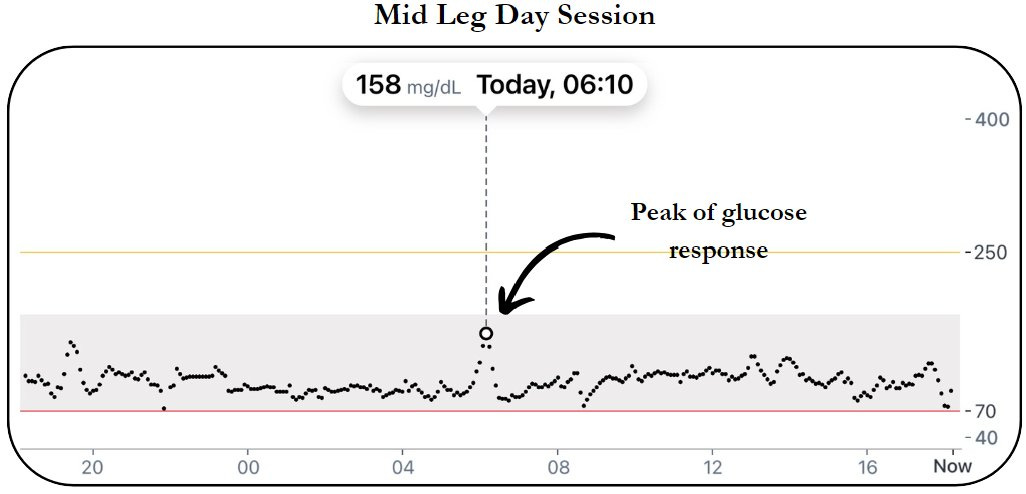
3) MID LEG TRAINING SESSION
Similar to the HIIT session in the previous day's test, I obtained a noticeable spike to 158 mg/dL ~halfway through.
Why?
Decreased glucose uptake: increased anaerobic energy demand (ATP) → increased intramuscular calcium signaling → inhibition of GLUT4 translocation → impaired glucose uptake
Reduced insulin sensitivity: increase in pro-inflammatory cytokines + reactive oxygen species → transient insulin resistance → spike in blood glucose
4) ACUTE STRESS RESPONSE
~9:30 AM, I was on a relatively stressful call & noticed a small spike of ~10 mg/dL
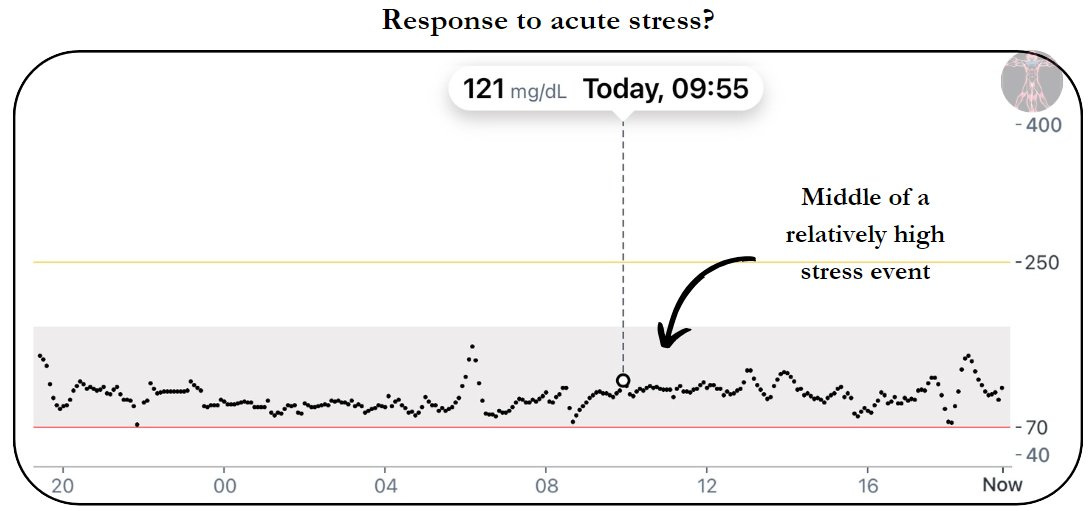
Why?
Sympathetic nervous system: activation of HPA axis → release of CRH + ACTH → release of cortisol → increased gluconeogenesis → decreased glucose uptake → spike in blood glucose
Pro-inflammatory cytokines: release of IL-6 & TNF-α → impaired glucose uptake → spike in blood glucose
Highlights from Day 5:
Ceylon cinnamon can be used as an effective tool to reduce the rate of change & peak blood glucose response
Intense, anaerobic exercise can significantly increase the blood glucose response
A stressful event can lead to a transitory spike in blood glucose & quickly normalize to baseline, however chronic stress can lead to stress-induced hyperglycemia
Day 6: High Protein/High Fat/Low Carb
Day 6 intent = show difference in glycemic response between high protein/high fat/low carb meals with vs. without postprandial walk
Each meal:
1 chicken breast
3 cups egg whites
5 eggs
1 avocado
1 whey protein shake w/ 10 g collagen
150 g protein + 50 g fat + 10 g carbs
1) MEAL 1 W/ POSTPRANDIAL WALK
Pre meal → 102 mg/dL
Peak of glucose response → 114 mg/dL
Post meal trough → 85 mg/dL
Pre meal to peak (% change) → + 12%
Peak to trough (% change) → - 25%
Time from pre to post → 150 min

2) MEAL 2 W/O POSTPRANDIAL WALK
Pre meal → 98 mg/dL
Peak of glucose response → 139 mg/dL
Post meal trough → 93 mg/dL
Pre meal to peak (% change) → + 42%
Peak to post (% change) → - 33%
Time from pre to post → 175 min

How did the postprandial movement response compare to no activity post meal?
Peak of glucose response = - 25 mg/dL
Time from pre to post = - 25 min
Highlights from Day 6:
Regardless of the macronutrient content of the meal, you need to be implementing postprandial movement for a min of ~20 min
Heavy protein/fat meals delay peak blood glucose (~2 hr)
They also reduce peak blood glucose compared to isocaloric carbohydrate-heavy meals
A whey protein shake consumed pre-meal can also delay & reduce glycemic response
Our bodies desire glucose so much they will convert non-carbohydrate sources to it via gluconeogenesis
Day 7: Fasted Zone 3/4 + 30-min sauna
Day 7 intent = highlight the impact of the
Pre workout → 84 mg/dL
Peak of glucose response → 137 mg/dL
Post workout trough → 76 mg/dL
Pre meal to peak (% change) → + 63%
Peak to trough (% change) → - 45%

How does mid-intensity cardio w/ sauna compare to HIIT?
Peak of glucose response = - 37 mg/dL
Highlights from Day 7:
Overall, I observed similar gradients (rise & fall) with a higher peak glucose response during high intensity anaerobic exercise.
Day 8: High nnEMF/Artificial Light + Low Sun Exposure
This was by far the most interesting & unexpected outcome of my CGM testing.
Running the identical high carbohydrate AM meal (oatmeal), I put myself in a high nnEMF environment by sitting < 1 ft for 2 hr:
Wi-Fi router
Phone charging
Bluetooth headphones
(2) laptops charging
At 9 AM, I entered into these conditions & started eating my first meal.
Graphs 1 & 2 show pre-meal BG at 90 mg/dL and a spike to 145 mg/dL (comparable to past days w/o movement after meal).

But the post meal trough is what shocked me: my BG declined to ~115 mg/dL then flatlined there for ~2 hrs.
Representing a 28% increase from sun exposed, lower nnEMF conditions (~90 mg/dL).
At 1 PM, I had the identical high carb PM meal (white rice) seeing a similar spike, but instead exited these conditions + got 30 min of midday sun exposure. Shortly after, hitting a trough at 88 mg/dL & baselining at a more typical 95 mg/dL.
So what might be going on here?
First, I’ll preface by saying this: these are interesting findings in an experiment I controlled tightly over this period, however this particular one is a test I would need to replicate over a week-long period across a variety of conditions to identify if this phenomenon holds true.
Now let’s start with a couple aspects we have some certainty on: 1) nnEMFs act as environmental toxins in both human & animal studies & 2) excessive amounts of nnEMFs & blue light can induce high levels of oxidative stress.
An increase in oxidative stress can induce insulin resistance in peripheral tissue via six pathways:
Mitochondrial dysfunction
Oxidative stress → disrupts mitochondrial respiratory chain (MRC) → reduces the respiratory capacity → compromises integrity of mitochondrial membranes → reduction in ATP → reduced glucose uptake in adipocytes + muscle cells
Downregulation of insulin signaling
Oxidative stress → Serine Phosphorylation of insulin receptor substrates → disruption of insulin receptor signaling → inhibition of Phosphoinositide 3-Kinase (PI3K) pathway → impairment of Akt signaling → downregulation of insulin proteins
Reduction of GLUT-4 expression
Initiation of oxidative stress → activation of stress kinases (JNK & p38 MAPK) → phosphorylation of insulin receptor substrates → suppression of transcription factors → impaired promoter binding → downregulation of GLUT-4 expression → decreased glucose uptake
β-cell dysfunction
Generation of reactive oxygen species (ROS) → activation of apoptotic pathways → disruption of metabolic pathways → inhibition of insulin gene expression
Upregulation of inflammatory cytokines
Initiation of inflamed cells → activation of cytokine induced signaling pathways (JNK & IRS-1) → impairment of insulin signaling transduction → elevated levels of pro-inflammatory cytokines (CRP & IL-6) → impairment of glucose uptake
Depletion of antioxidant defense
Overproduction of ROS → imbalance in redox homeostasis → inactivation of antioxidant enzymes → activation of NF-κB pathway → lipid peroxidation + protein oxidation → impaired insulin secretion

Highlights from Day 8:
These conditions emulate the reality for many on a daily basis: Blast with blue light while sitting in a room with artificial overhead lighting beaming nnEMFs for 8+ hr with 5 - 10 min of total sun exposure
And further highlights the importance of dialing in postprandial glycemic responses:
Full spectrum sun exposure during AM + PM
Movement after meals
Diligently manage nnEMF exposure
That rounds out the data I collected during this period. It’s a lot I get it. But it’s laid out in a relatively raw format for consumption for you all.
I’ll be making things much clearer in my next post. I’ll detail a variety of different methods we can use to attenuate fasting blood glucose including what worked best and how we can further improve long-term metabolic health.
As always - take what fits + leave what doesn’t.
Thanks for reading,
BTP
Curious to know what your opinion of HIIT is then? Obviously, its not bad for you, but maybe overdoing HIIT is? Or is HIIT just bad in general?